The Case for Gold Miners in 2024
Summary
- We think gold can outperform this year in various scenarios – for example, if the Fed pushes too aggressively for a soft landing through rapid cuts, or alternatively if employment rolls over quicker than many expect. We like playing the asset class through gold miners, and this report analyzes the sector in more detail.
- Despite long-term underperformance relative to gold, the gold miners have experienced periods of outperformance and we think 2024 is an attractive setup given cheap valuations and margins that may be bottoming.
- Longer-term, we view gold miners as deeply cyclical and capital-intensive businesses with risks such as rising mining costs and modest production growth. We do not believe gold miners are a suitable long-term investment but make the case for a short-term trade.
- The four senior gold miners we analyze (Newmont, Barrick, Agnico-Eagle and Kinross) currently offer upsides of 39% to 52% relative to their downsides of 36% to 21%, in scenarios we believe are reasonable for underlying gold prices and production outcomes. We recommend getting long the names as a basket with a light short on gold as a hedge.
Introduction
We think the risk/reward of gold is attractive on a 6–12-month time horizon and that it can outperform in several realistic scenarios.
- First, the upside risk – The Fed is clearly pushing harder for a soft landing. In doing so, it is possible they cut prematurely, pushing down real yields, before inflation has been fully tamed. The recent rise in breakevens hints towards this risk and would be supportive of inflation hedges like gold.
- Second, the downside risk – This late in a cycle with a softening jobs market, it doesn’t take much for the ‘Goldilocks’ narrative to turn into a growth scare, driving a flight to quality bid for gold.
- Third – While geopolitical risks are always in the background, they seem particularly high today.
- Lastly – A very low risk premium in equities and credit means the opportunity cost of gold is lower today.
We think gold miners are an attractive way to play potential upside in gold for a trade, despite clear long-term risks in the names.
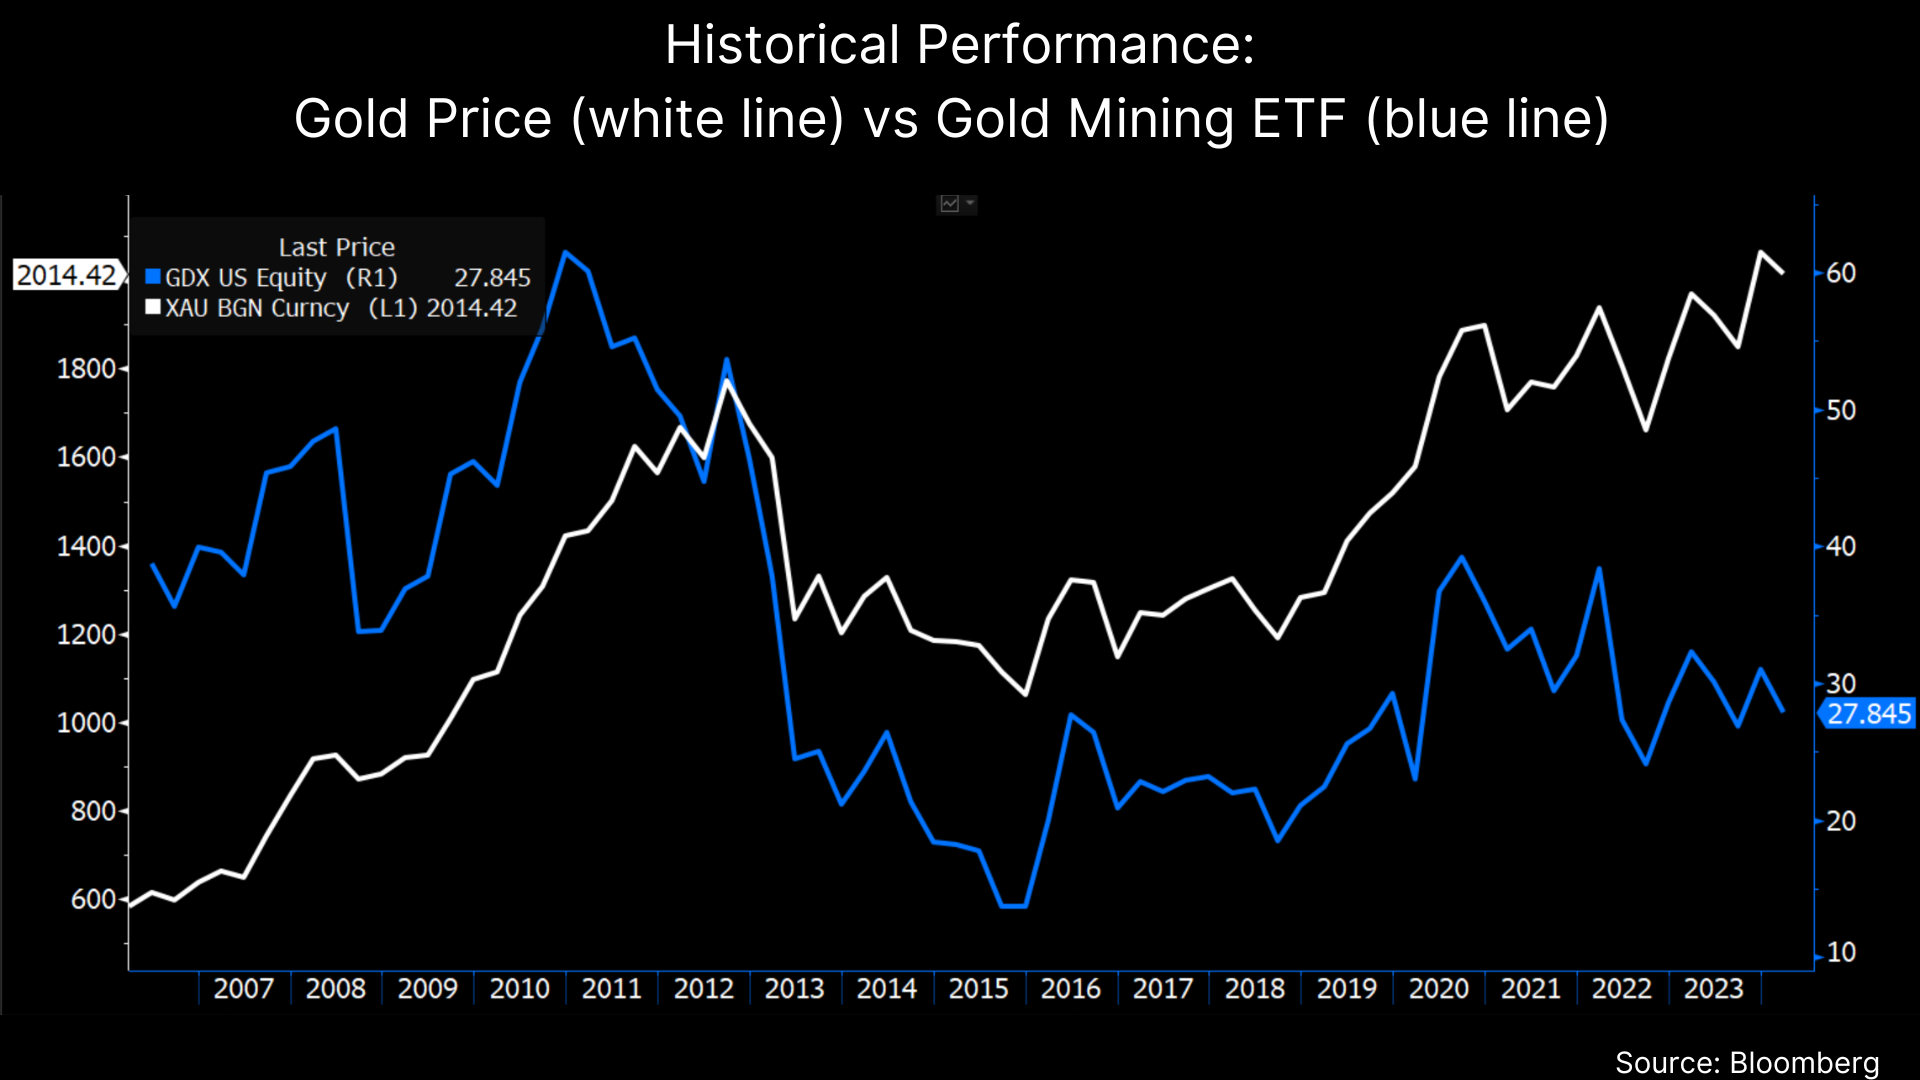
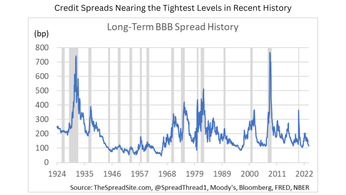
Looking back historically, owning gold as a commodity has been a much better investment than owning gold miners as the chart below shows. The reasons for the long-term underperformance are varied, but generally mining gold carries a substantial amount of operational risk and cost to grow production vs simply owning the commodity.
The long-term total returns of senior gold mining companies we discuss below have also been mediocre (returns assume dividends reinvested in underlying shares):
Newmont: 4.2% annualized since 7/28/80
Barrick: 6.1% annualized since 2/25/87
Agnico Eagle: 4.4% annualized since 9/3/85
Kinross: 3.3% annualized since 6/15/92
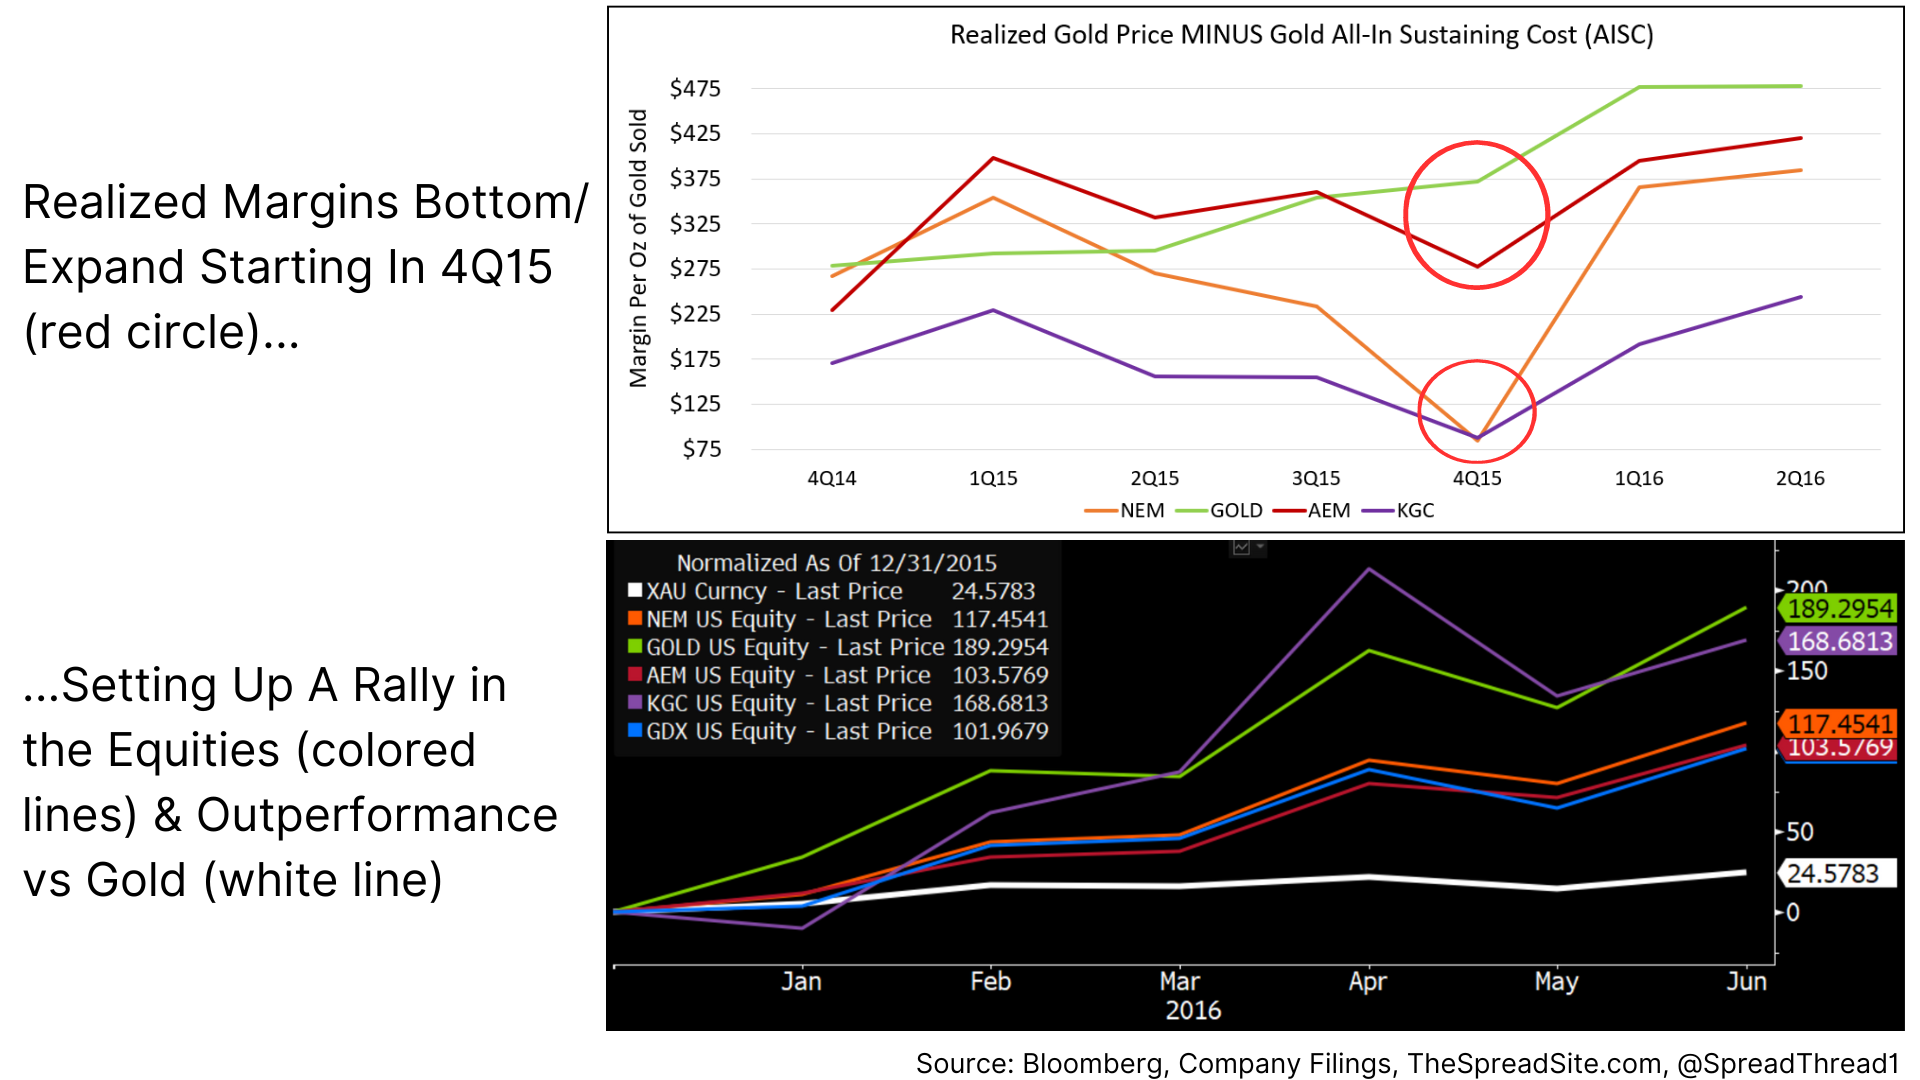
However, within the long-term trend there have been periods of gold miner outperformance. For example, in 2016, they started the year at cheap valuations, then rose dramatically as costs moderated and gold moved higher. We think 2024 looks similar and believe the senior gold miners (“NEM”, “GOLD”, “AEM”, “KGC”) are worth owning as a trade given starting cheap valuations and asymmetric upside to expanding margins. However, we are not suggesting this trade as a long-term investment as these companies are deeply cyclical, capital intensive and have costs suffering from high inflation. Below we dig into the gold miners in more detail and walk through why we like the sector as a play on gold.
Background on Gold Miners
Generally, the gold miner market is divided between senior and junior mining companies. Junior miners are typically seen as higher beta plays on gold given their more speculative activities exploring for new reserves. We do not look at the junior miners in this report but the “GDXJ” ETF offers sector exposure to this group.
Our focus is on the large and well-established senior gold miners, specifically Newmont (“NEM”), Barrick (“GOLD”), Agnico-Eagle (“AEM”) and Kinross (“KGC”) while choosing to omit Anglogold Ashanti (“AU”), Gold Fields (“GFI”) and Harmony Gold (“HMY”) given their less robust reporting standards. The ETF incorporating the senior gold mining companies is “GDX” and the four companies we analyze comprise ~35% of this ETF.
Since the start of 2023, gold’s performance has been solid, up about 11% and currently trading near $2,017/oz. The gold miners’ performance varied significantly as the chart below illustrates.
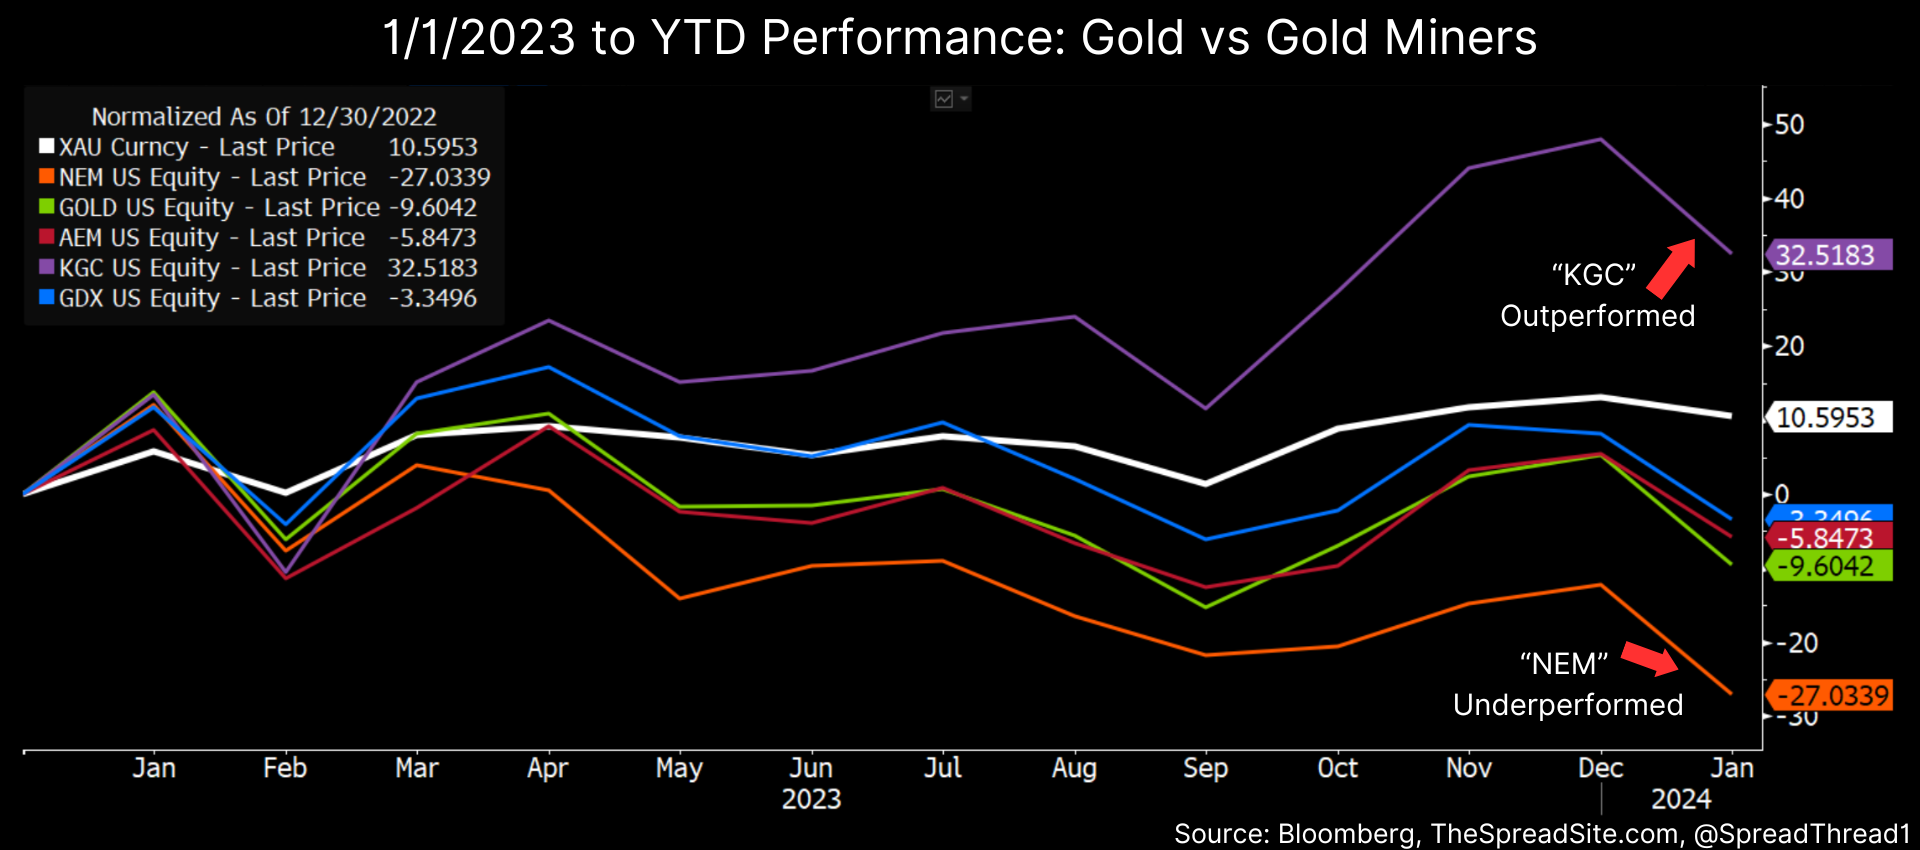
The two outliers, KGC and NEM experienced opposing trends during the year. Kinross’s cost outlook improved allowing the stock to re-rate higher and rally ~33%. Newmont, on the other hand, fell ~27% as they did a large acquisition and suffered from cost over-runs plus lower production partly due to a 120-day strike at their Peñasquito mine. Their acquisition, a ~$19b deal to buy Newcrest Mining, which closed 11/8/23, was generally thought to be expensive on an EBITDA multiple at ~9.5x. And the labor strike forced Newmont to lower full-year production by ~12%. Both situations generally cause a gold miner to re-rate lower. Barrick also underperformed, more so recently, as they pre-announced softer cost and production guidance on 1/16/23.
Valuation
The senior gold miners we highlight generally have higher quality mines with less geographic risk, but both are a consideration in valuation. Other areas of focus are overall mine life, production growth and mining cost, with Agnico-Eagle seen as arguably the highest quality and lowest beta name.
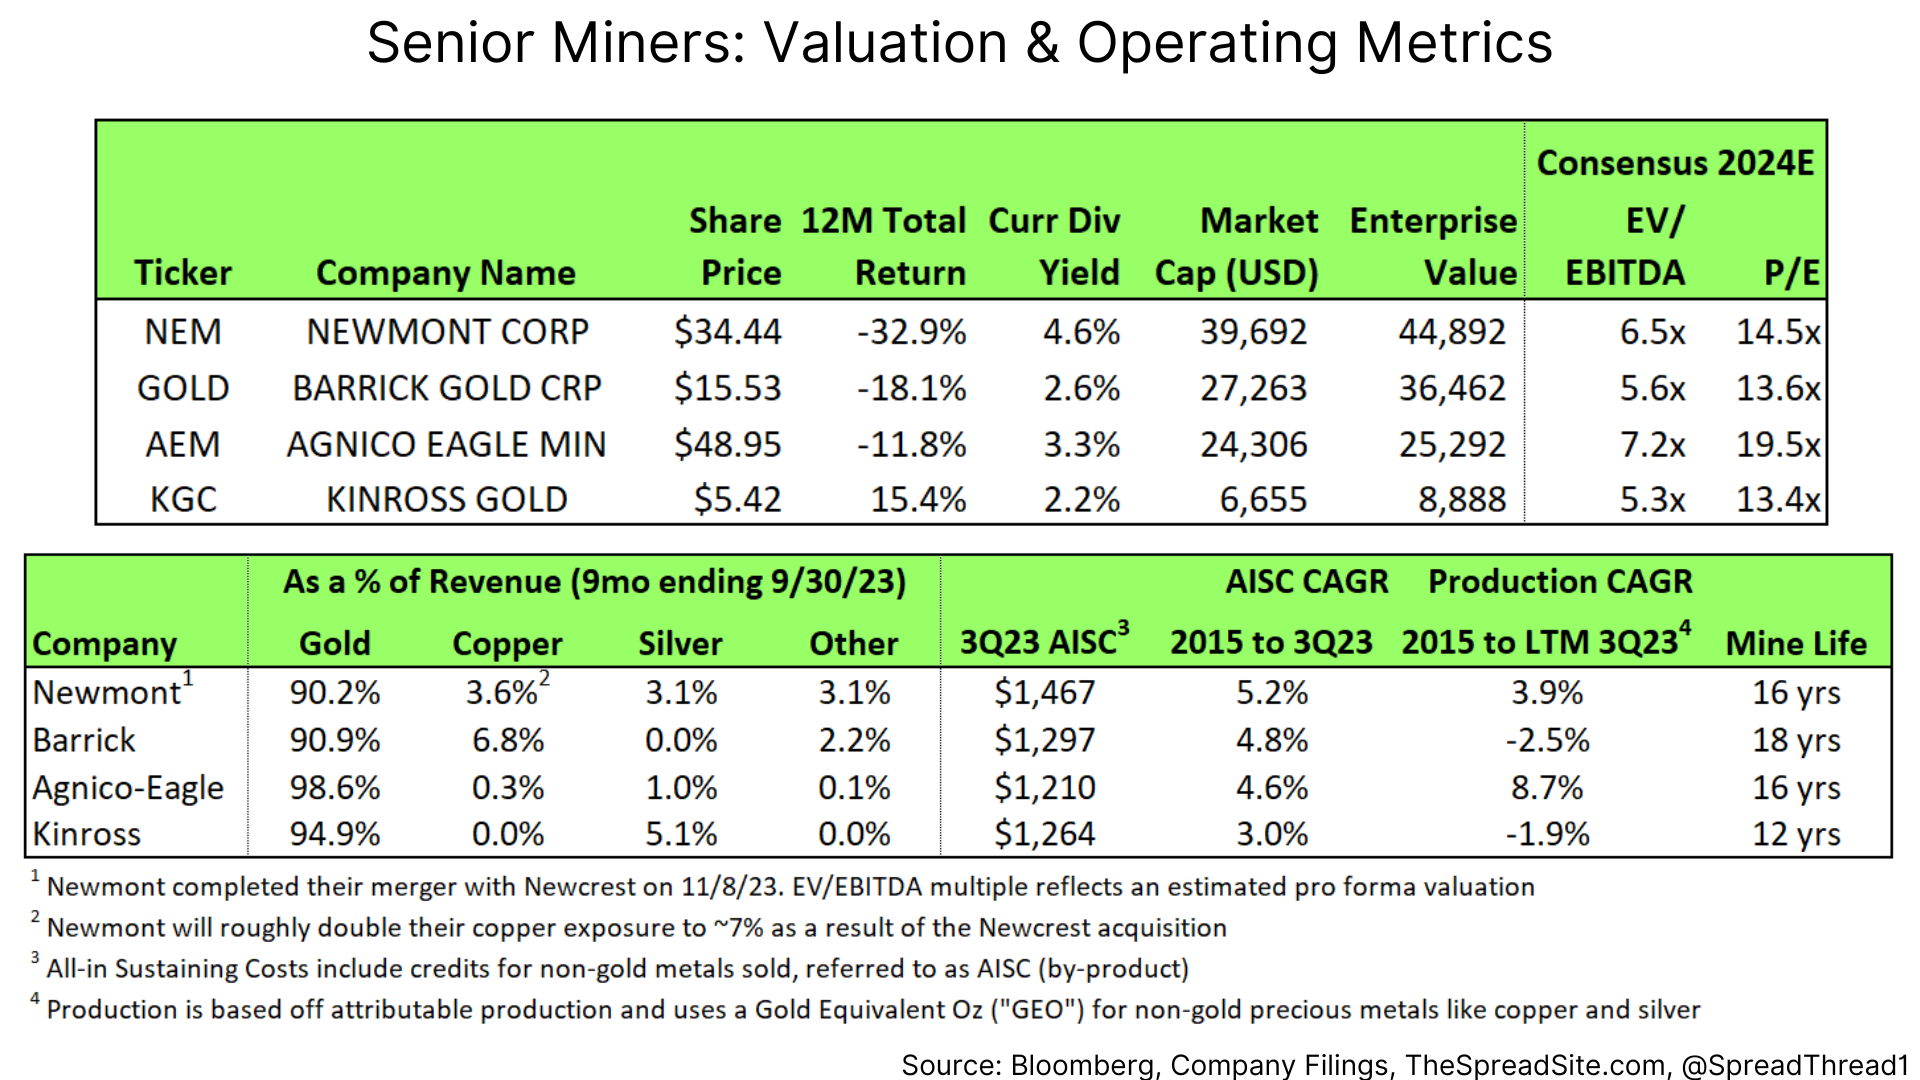
Below we show summary comp data and a snapshot of revenue by metal, cost, production growth and mine life. As can be seen, AEM trades at the highest multiple while also faring best in terms of production growth and costs.
A quick sidenote on costs: we show a metric used by gold miners called “all-in sustaining cost” or “AISC.” This metric was created by the World Gold Council and is used by most gold miners to help investors compare costs across companies. More information on AISC can be found on the World Gold Council’s website here, but this is a per oz metric that is meant to include all costs related to sustaining gold production, including maintenance capex. The difference between realized gold price and AISC can be thought of as free cash flow per gold ounce before debt costs and growth capex.
On a historical basis, the gold miners are trending towards the low end of their EBITDA multiple ranges. We show data going back to 2015 but note that late 2012 and 2013 was another period where EBITDA multiples hit trough levels.
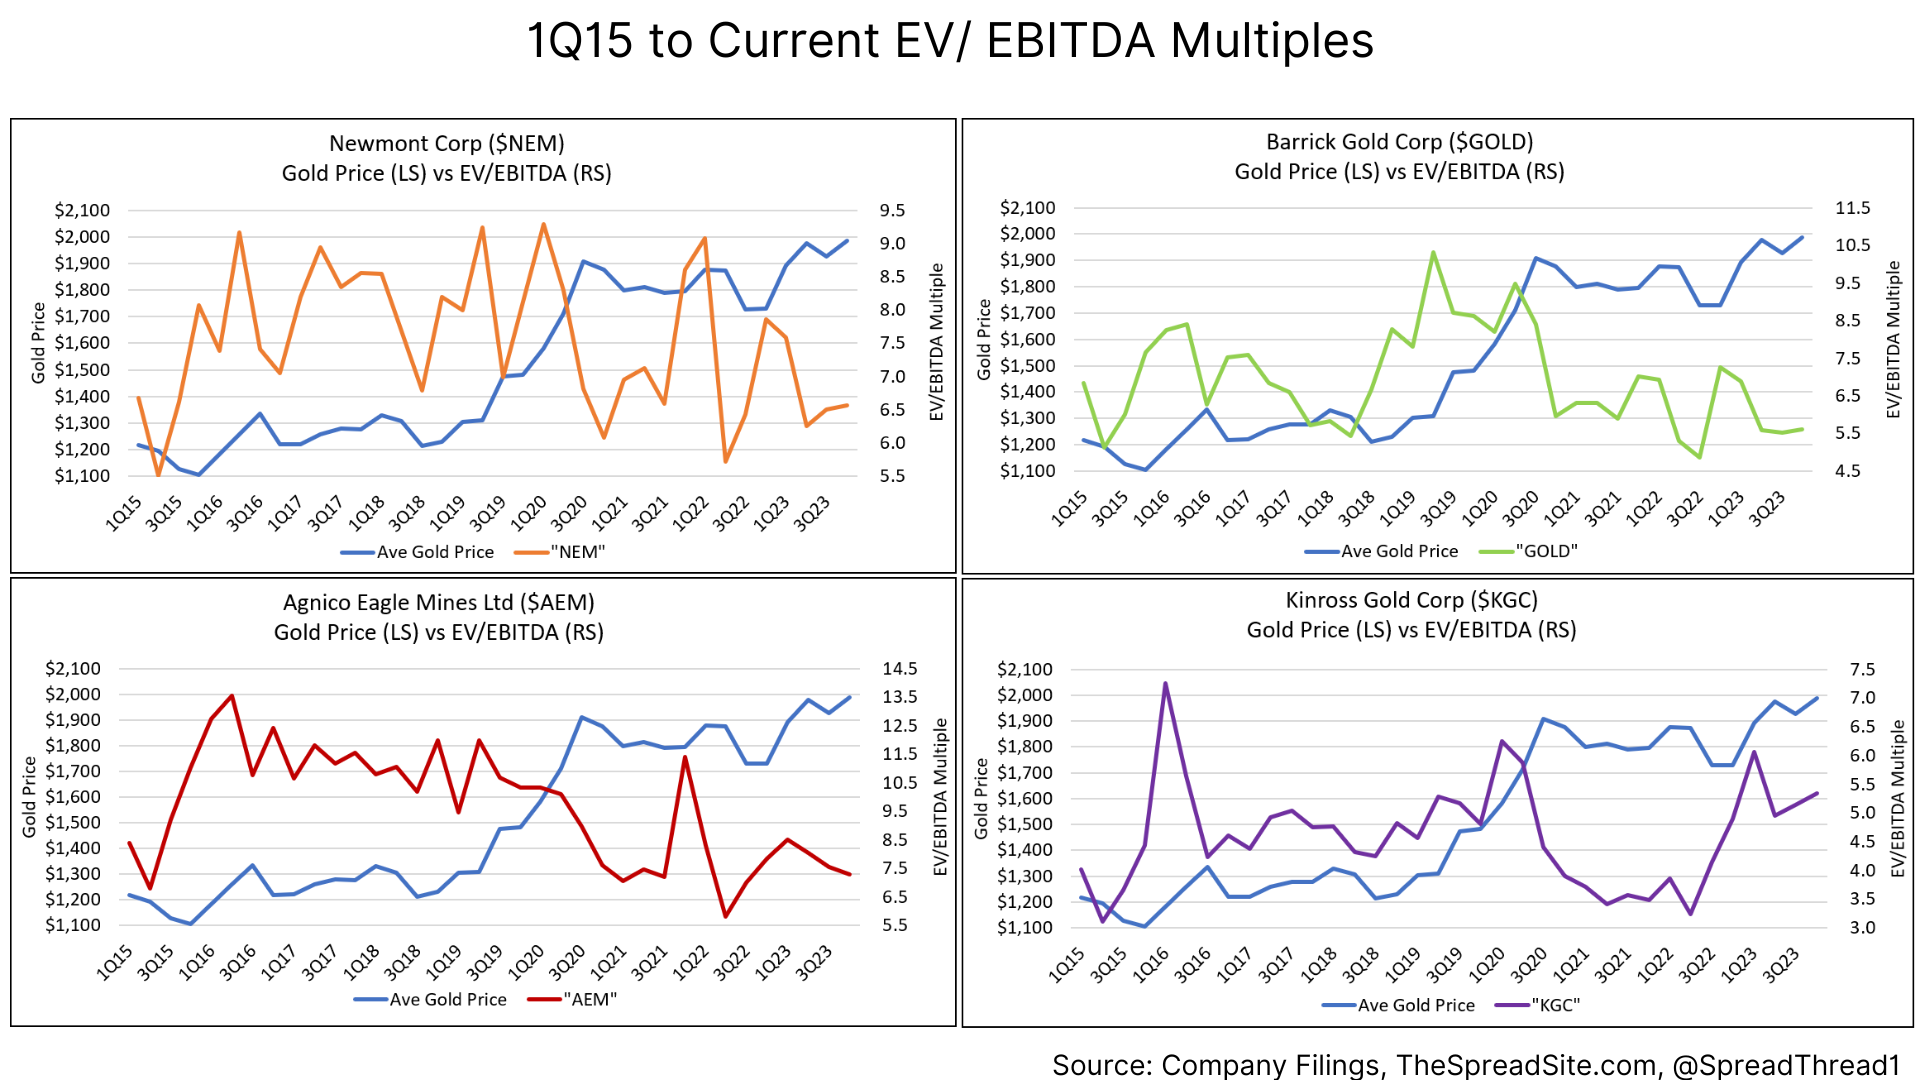
Reasonably cheap valuations are one of the reasons why we think the group is attractive. In other words, the miners could have asymmetric upside given a low base and the wide disconnect between the price of gold and valuations for the sector. We discuss a few reasons why this disconnect is occurring in the next section.
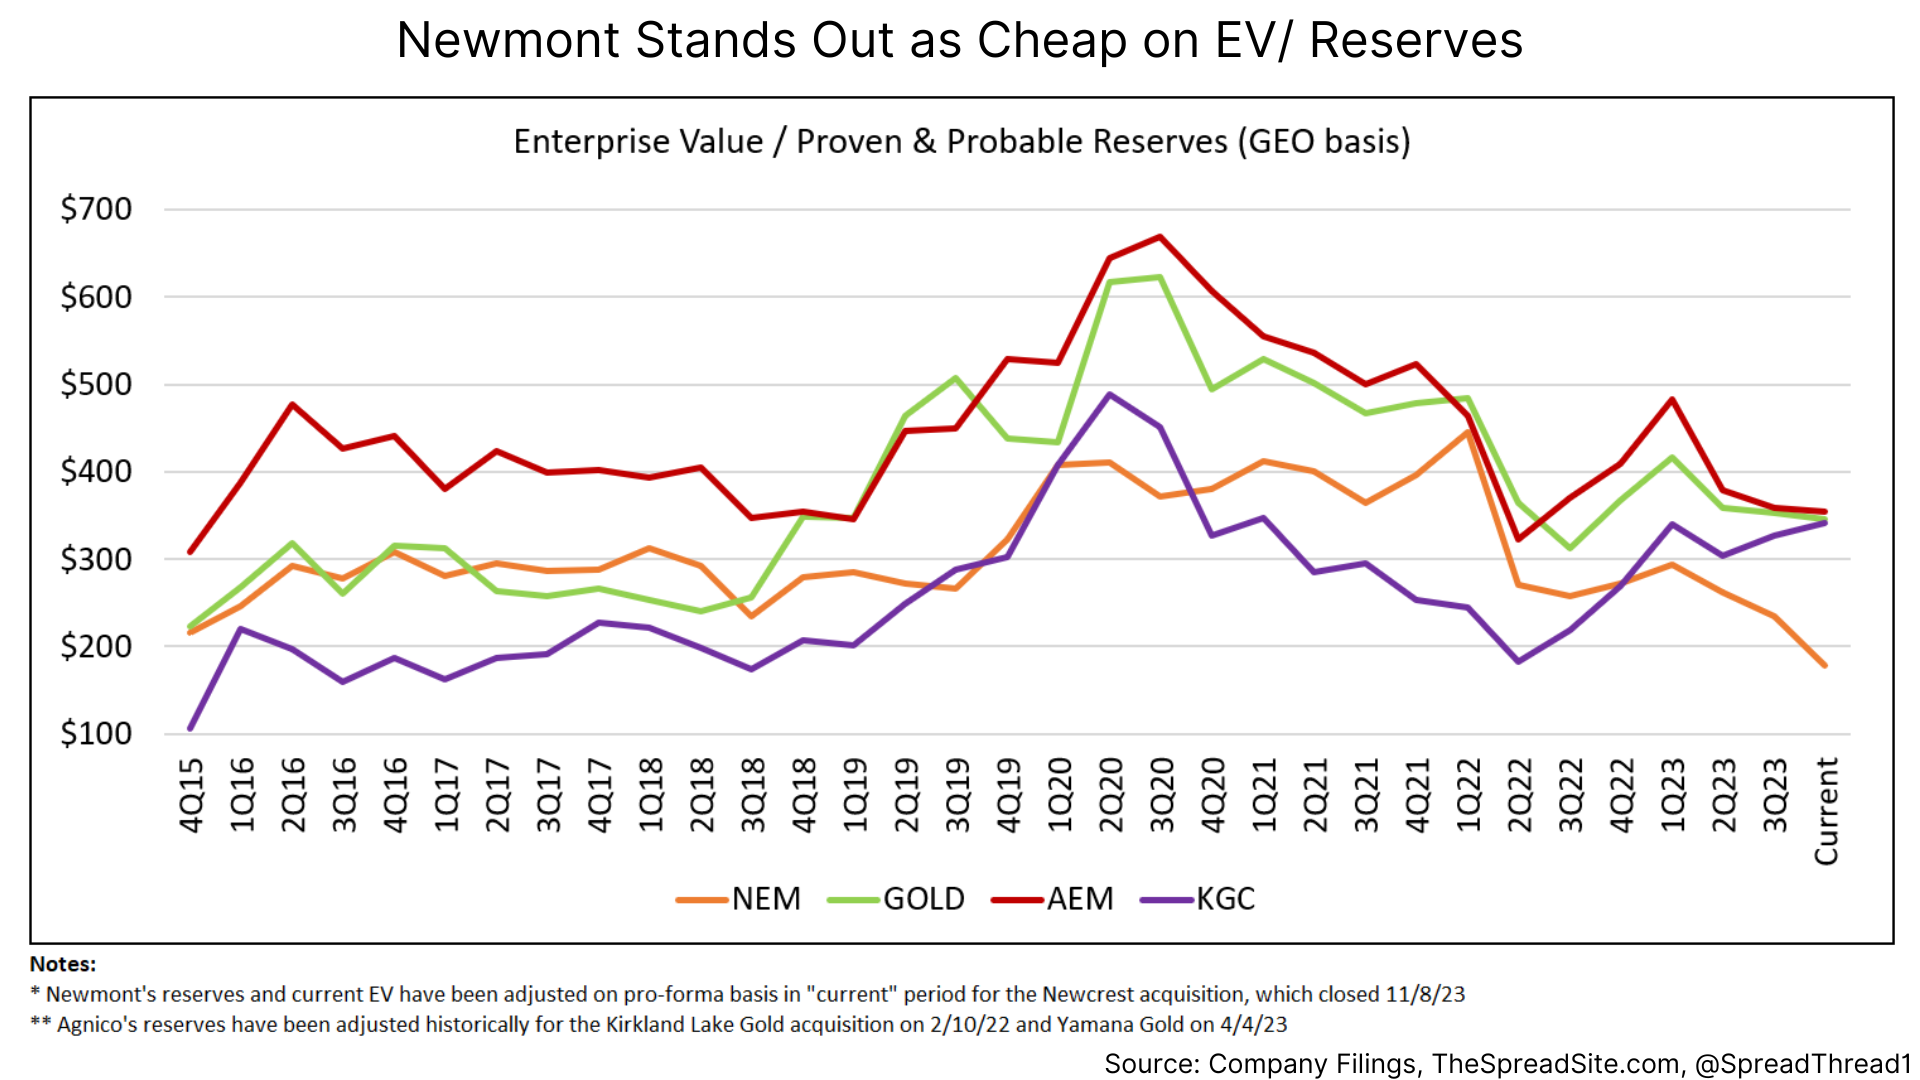
In terms of other valuation metrics, below we show EV/ reserves and free cash flow yield. The former has some issues as reserves are only updated annually and assumptions need to be made on the value of by-product production (i.e. silver and copper). However, we thought it was important to illustrate Newmont’s pro forma EV/ reserve discount is quite large but partly due to their acquisition of Newcrest, which always traded cheap on EV/ reserves.
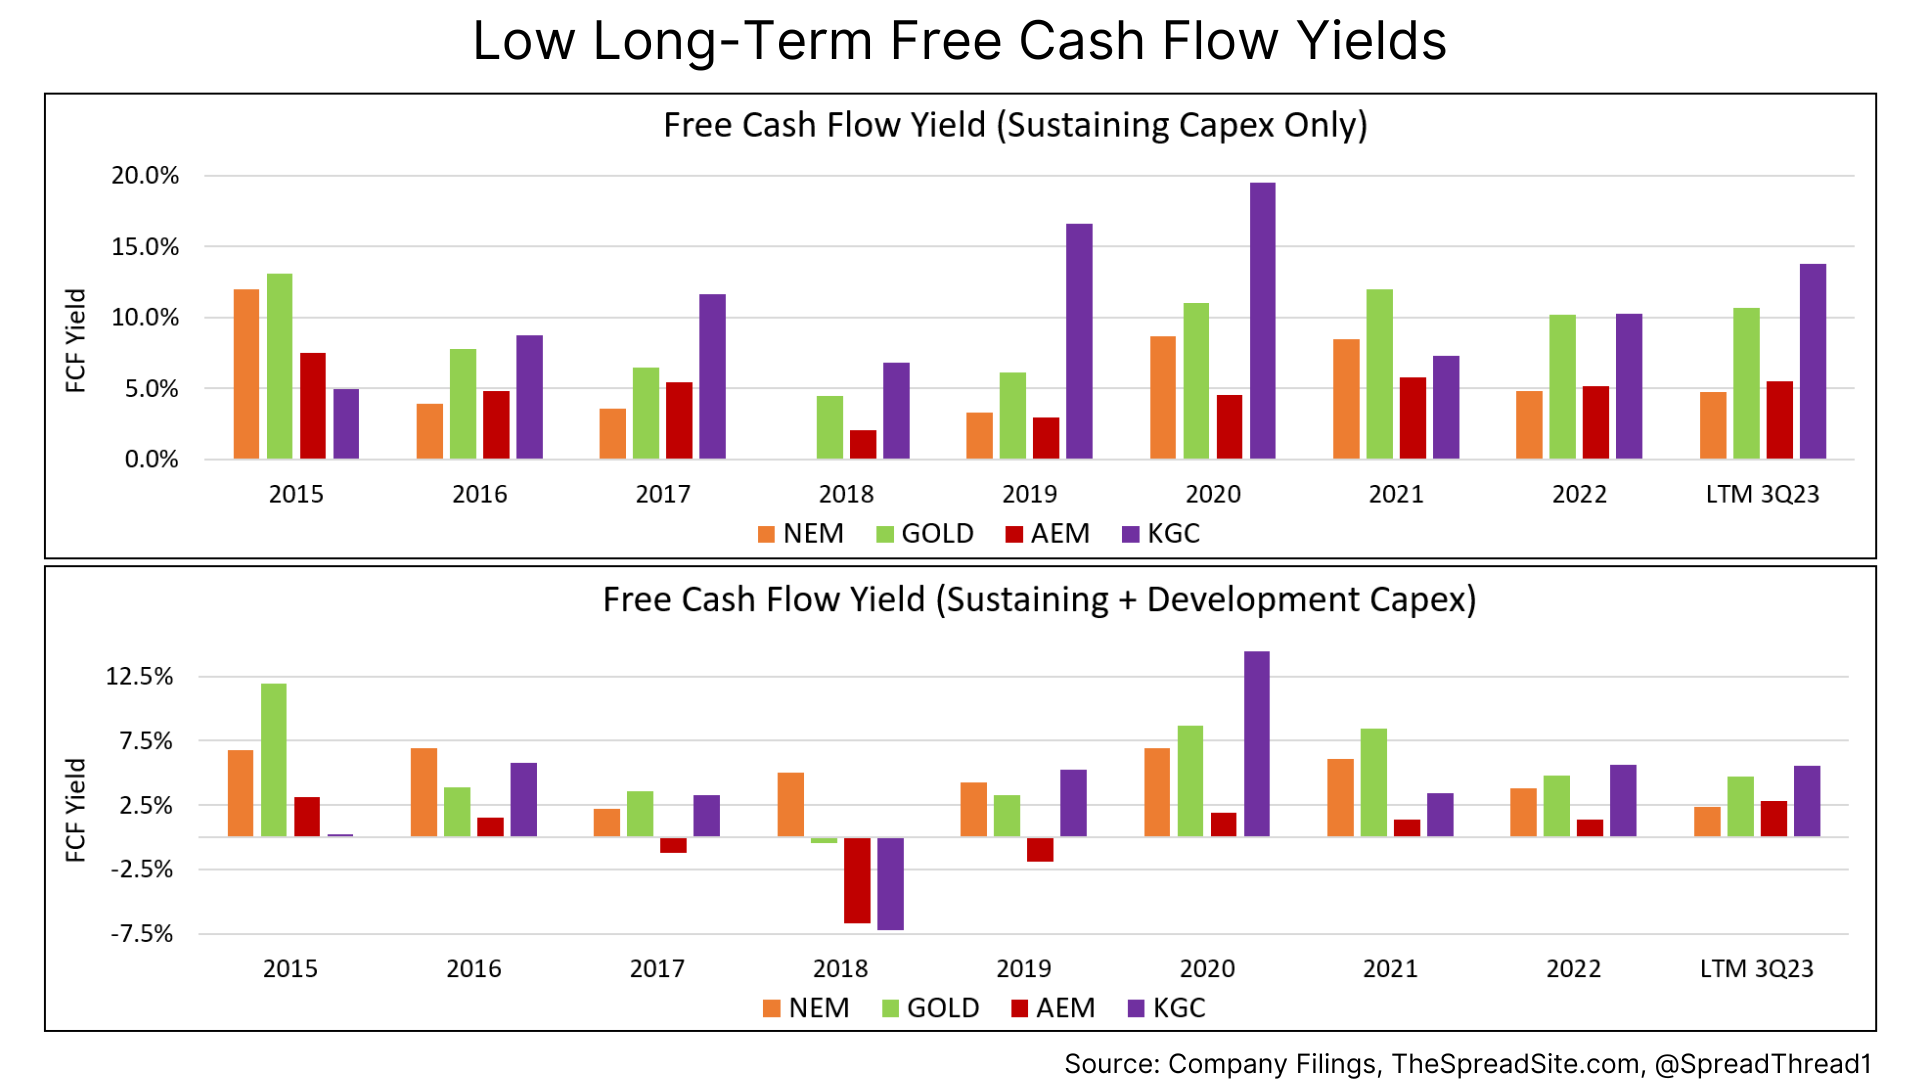
The gold miners do not fare well on free cash flow yield when viewed over time. As mentioned, gold mining is a capital-intensive business with a constant depletion of the underlying asset base.
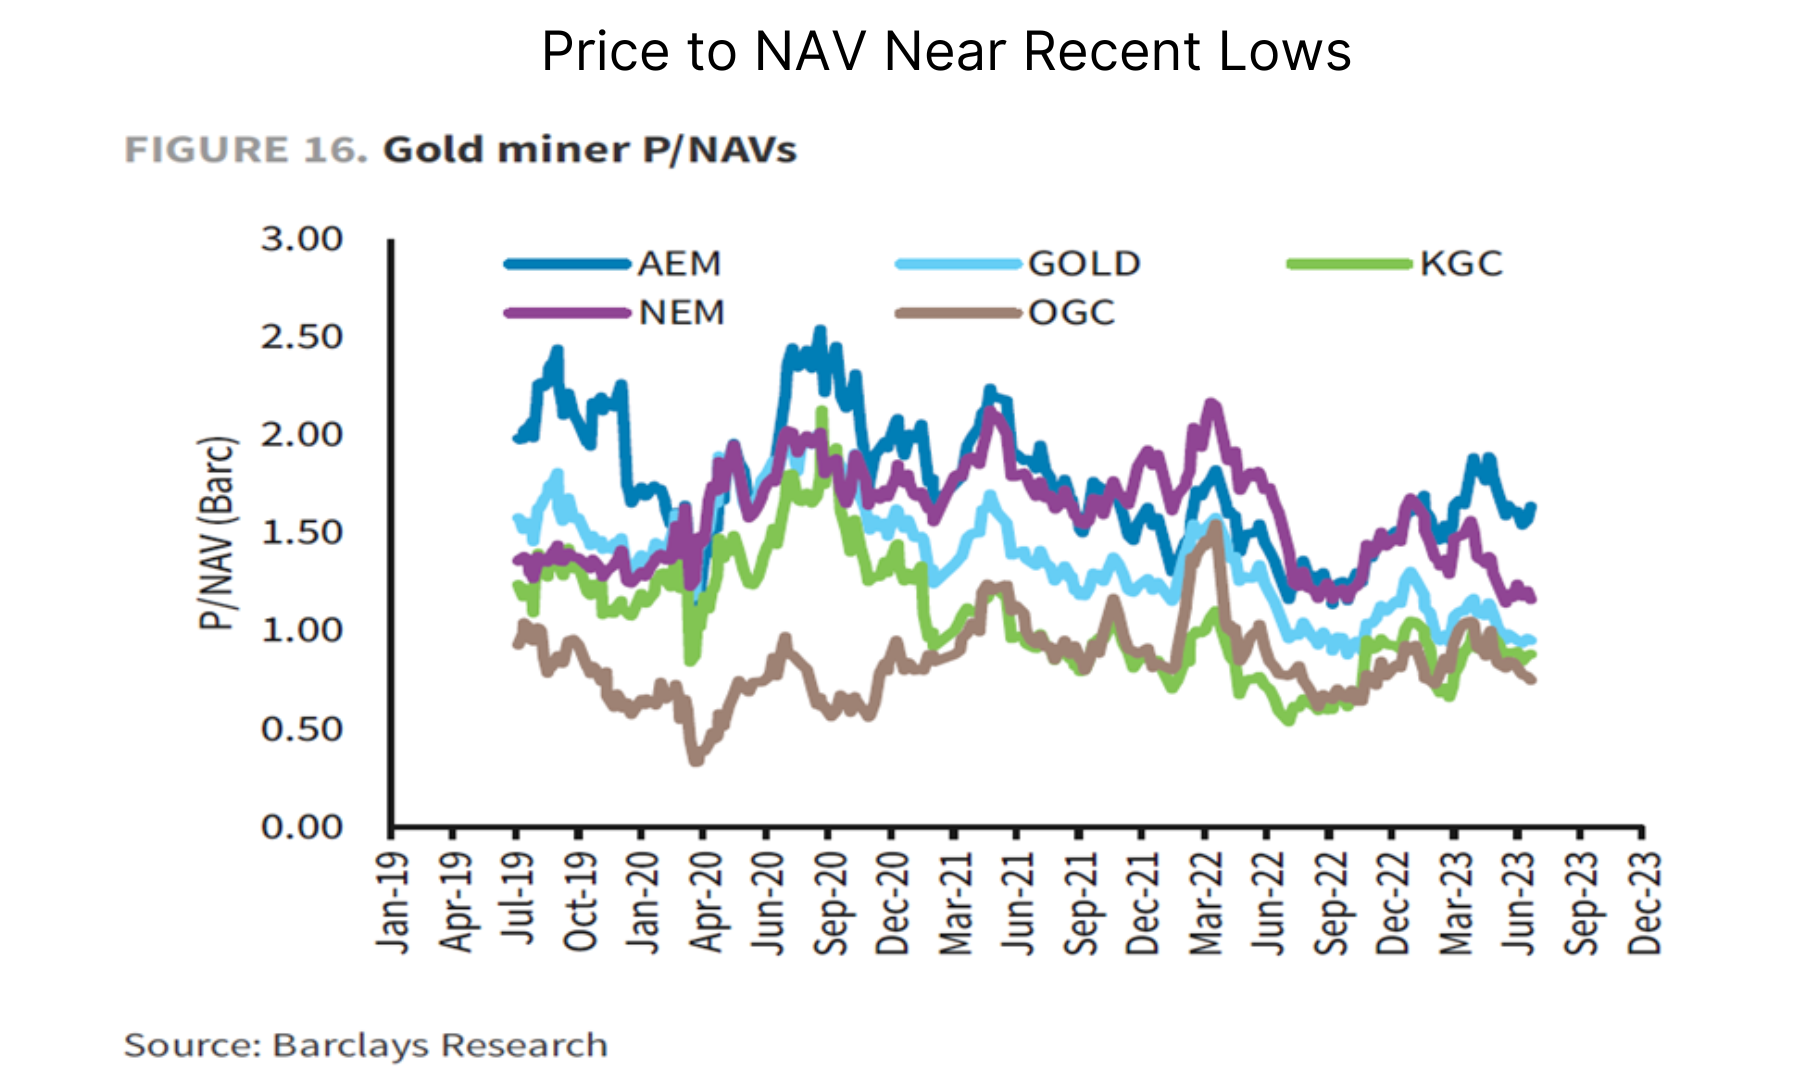
Investors also look at share price to Net Asset Value (“NAV”), which requires building a discounted cash flow model for every mine owned. We do not have NAV estimate for Newmont pro-forma, but note that the other names are near recent lows on this valuation metric.
Costs
Part of the reason gold miners have underperformed is due to their rising costs with the following increases in AISC (including by-products) from 2019 to 3Q23 as gold rallied 43%:
NEM: +50%
GOLD: +42%
AEM: +29%
KGC: +30%
The reasons for increasing costs are varied, from higher input costs such as fuel and labor to strikes in the case of Newmont. While the absolute level of spreads (realized gold – AISC) is important, the direction likely matters more.
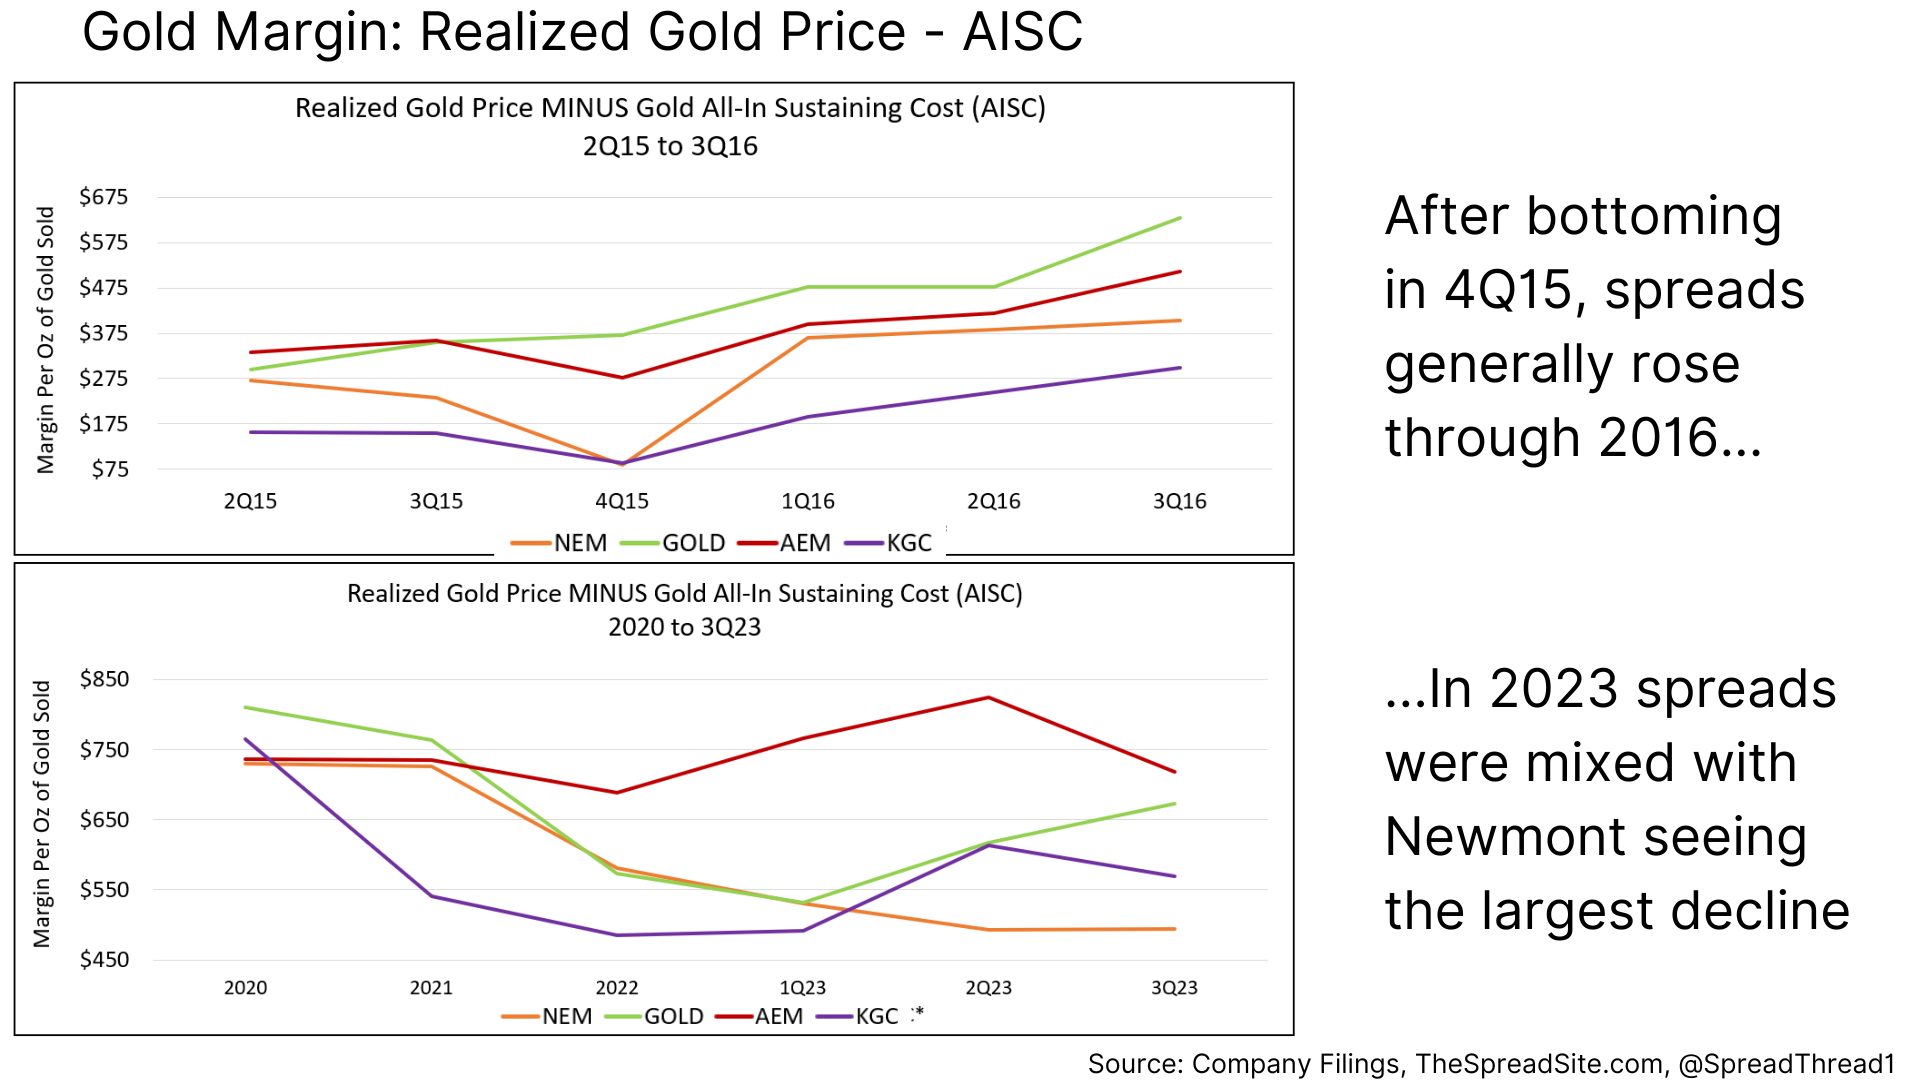
Past cycles can help provide context around current market dynamics. We think the period from 4Q15 through 2016 is a reasonable comparison. Margins and valuations bottomed around 4Q15 and started rising. Gold generally rose throughout this period, up about 20%, but the miners significantly outperformed as shown below.
Comparing to the 4Q15 to 2Q16 period, you can see that margins have generally trended lower from 2020 through 3Q23 and may have bottomed.
While difficult to forecast costs for the industry, we believe a lot of bad news is in the price and the risk/reward for 2024 is favorable. We want to be clear, however, that we view this as a trade and recommend stop losses to the extent costs continue to disappoint or the macro backdrop for gold deteriorates.
Risk/Reward for 2024
Our macro view should generally be supportive for gold prices. However, if we get an inflationary environment where gold miners’ input costs rise faster than the price of gold, they will likely underperform. So far, the operating environment is not off to a good start given Barrick’s 4Q23 pre-announcement of higher costs and softer production. Yet we do think the risk/reward favors getting long gold miners especially Newmont and Barrick given recent underperformance.
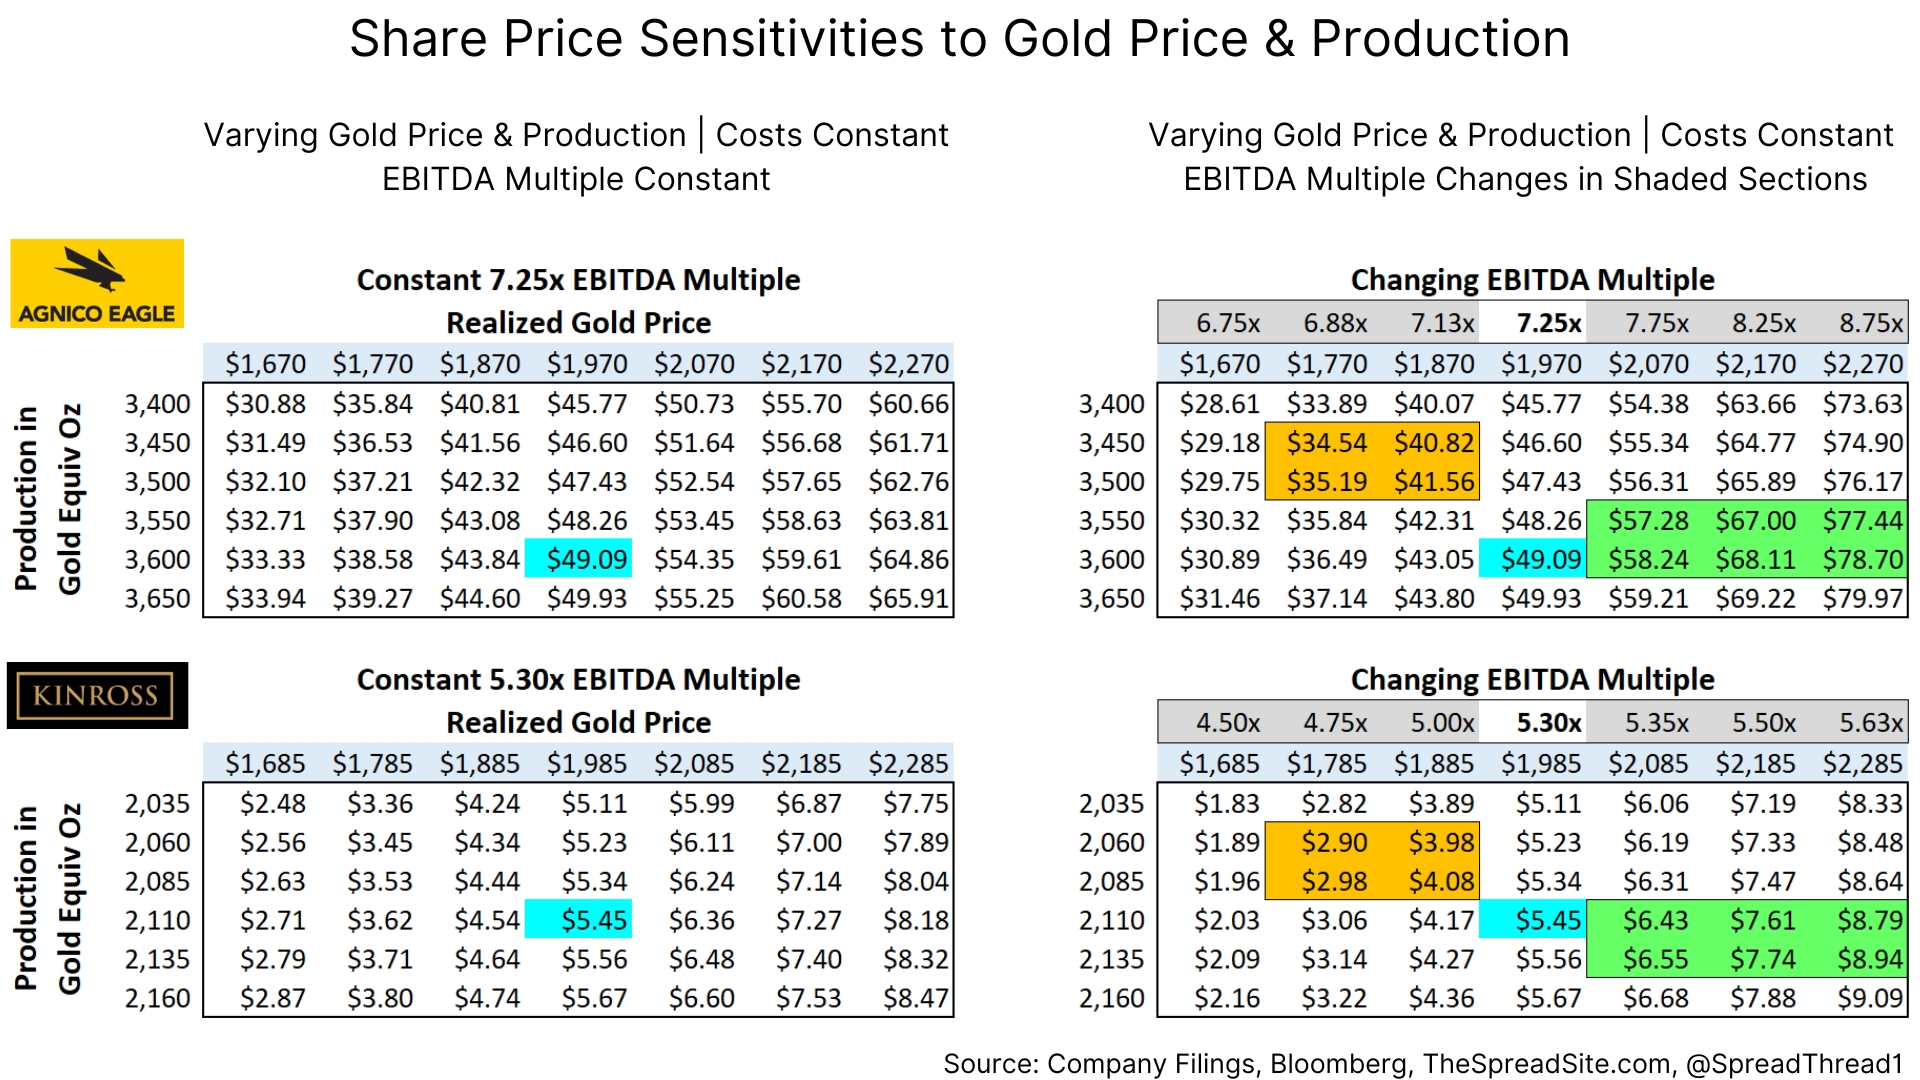
To illustrate the point, we created a few scenario matrices. They show our best estimate of what we think is priced in with respect to 2024E consensus estimates for realized gold prices and production (the turquoise squares). We then vary the price of gold and production, showing the resulting stock price on the left side (holding the current EBITDA multiple constant). On the right side we vary the multiple assuming an expansion if gold prices rise and production is better than expected (green cells) and vice versa if gold prices and production miss (orange cells). Each company is slightly different, but generally, EBITDA changes 10-14% per every $100 change in the price of gold. And while we hold production costs constant (which we realize is an oversimplification), they can also have a significant impact on EBITDA. Clearly, there can be infinite outcomes between production, gold prices and costs, but we think the green and orange cells are reasonable estimates of upside/downside scenarios.
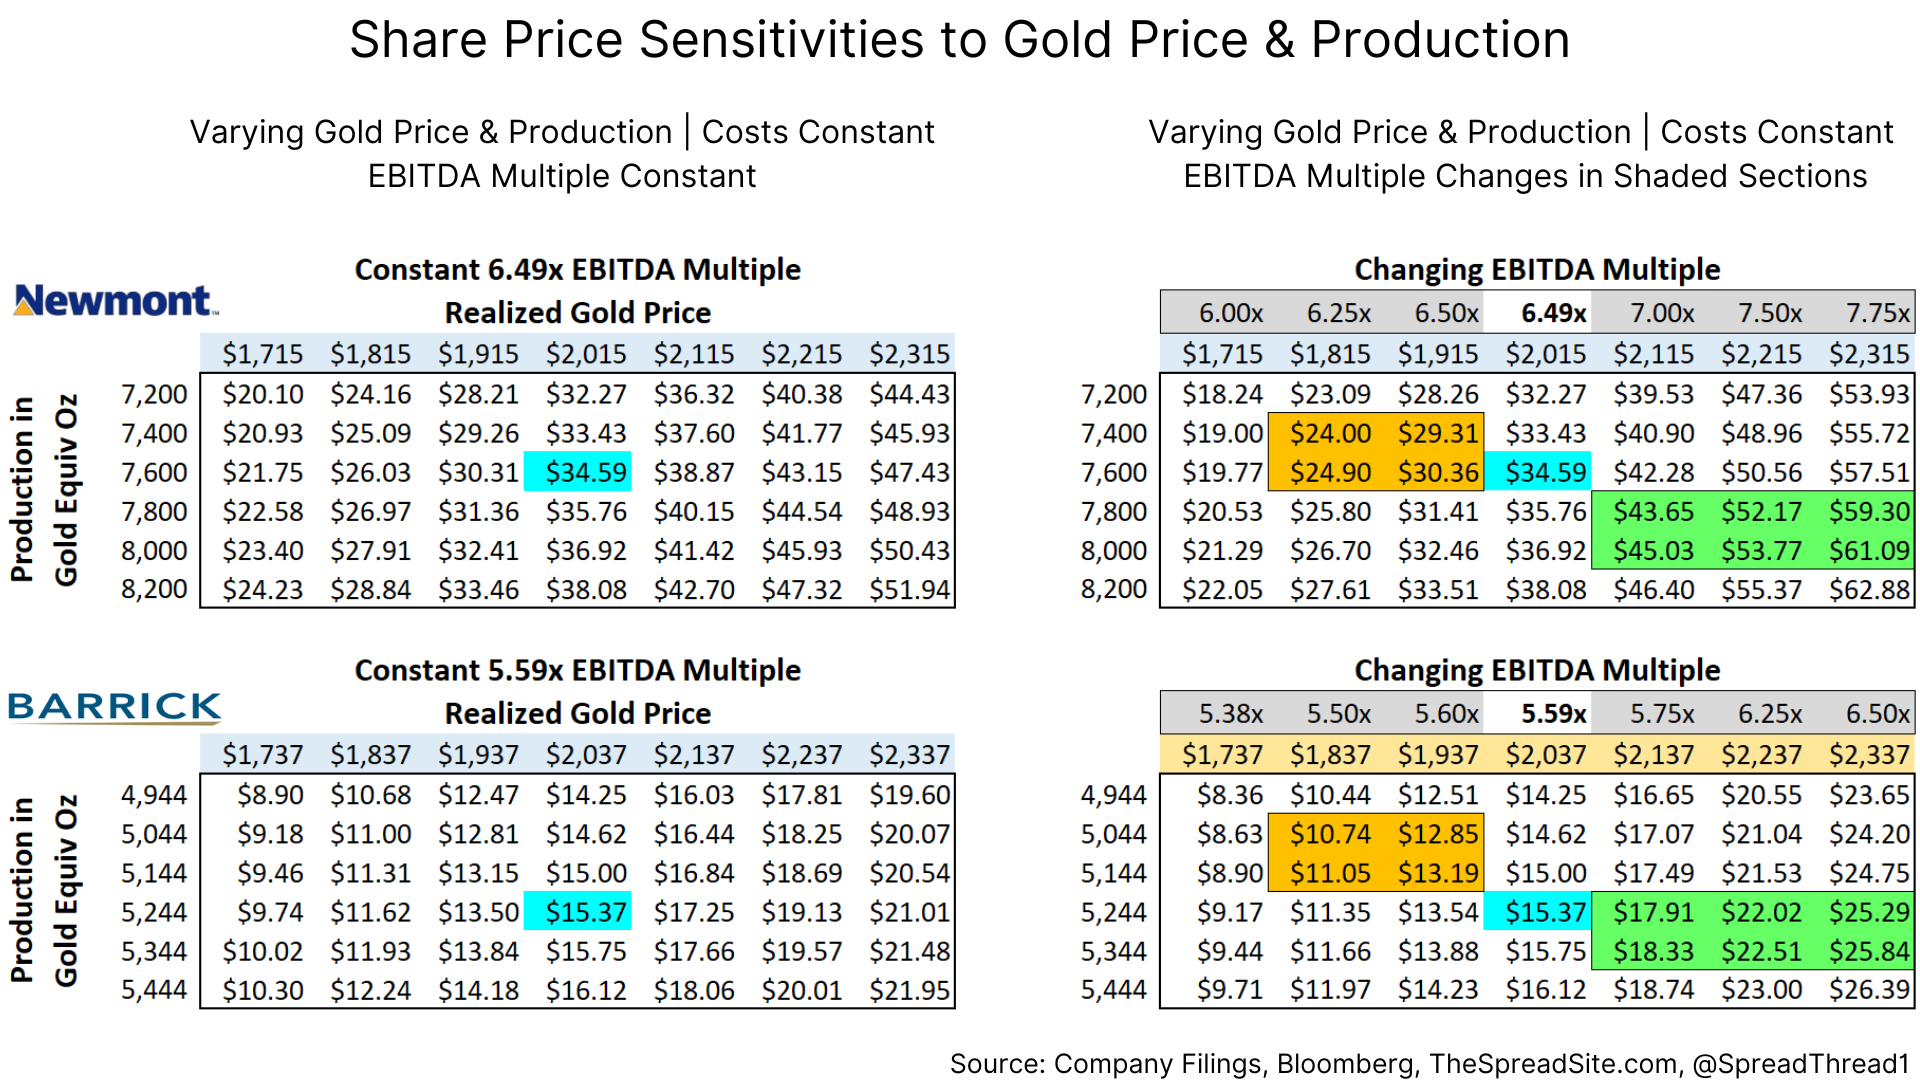
A quick note on Barrick: most of their mines are operated through JVs and trying to reconcile with consensus is messy so this name is subject to a larger margin of error.
Assuming equally weighted probabilities of each green/orange cell we get to the following downside/upside estimates in price and percent (rounded):
NEM: $27 / $53 | (21%) / 52% | 2.5x risk/reward ratio
GOLD: $12 / $22 | (23%) / 42% | 1.8x risk/reward ratio
AEM: $38 / $68 | (22%) / 39% | 1.8x risk/reward ratio
KGC: $3.50 / $7.70 | (3%) / 42% | 1.2x risk/reward ratio
Furthermore, we think the probability of the upside is larger than the downside, but weight them equally above. We like putting this trade on as a basket with perhaps slightly more weight into NEM and GOLD and a small short hedge in gold (the underlying commodity).
Reiterating, we think it is prudent to enter this trade with a stop loss given the risks on costs and the underlying commodity and our belief that these companies are unlikely to outperform the underlying long-term.
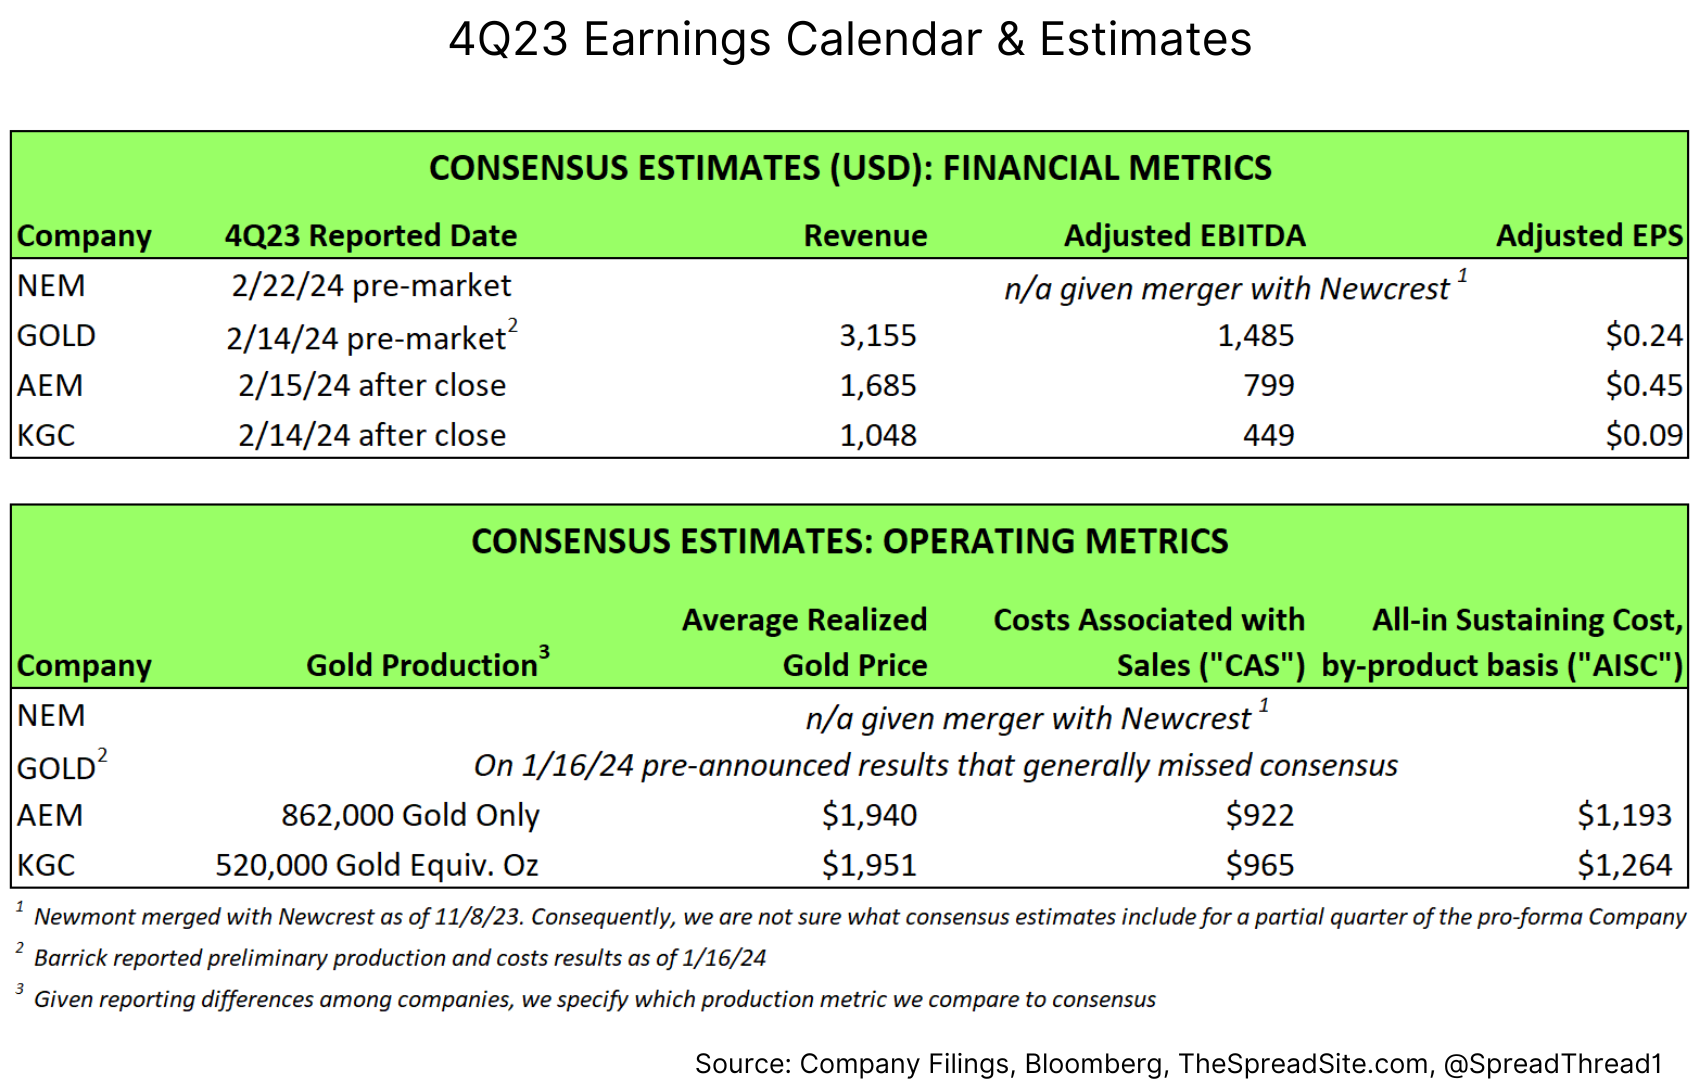
Caution Heading Into 4Q23 Earnings
The gold miners report in the middle of February. Barrick already pre-announced on production and cost guidance with AISC expected to be up 8 to 10% q/q. Putting on a trade before earnings can be a double-edged sword. Barrick’s pre-announcement likely lowered the bar for the remaining companies but also illustrated that the high operating cost environment may be sticky. Newmont’s fourth quarter is almost impossible to handicap and certain to be messy as they owned Newcrest for roughly half of the quarter and current 2024 consensus could change significantly. We would err on the side of caution prior to 4Q23 earnings.
Appendix
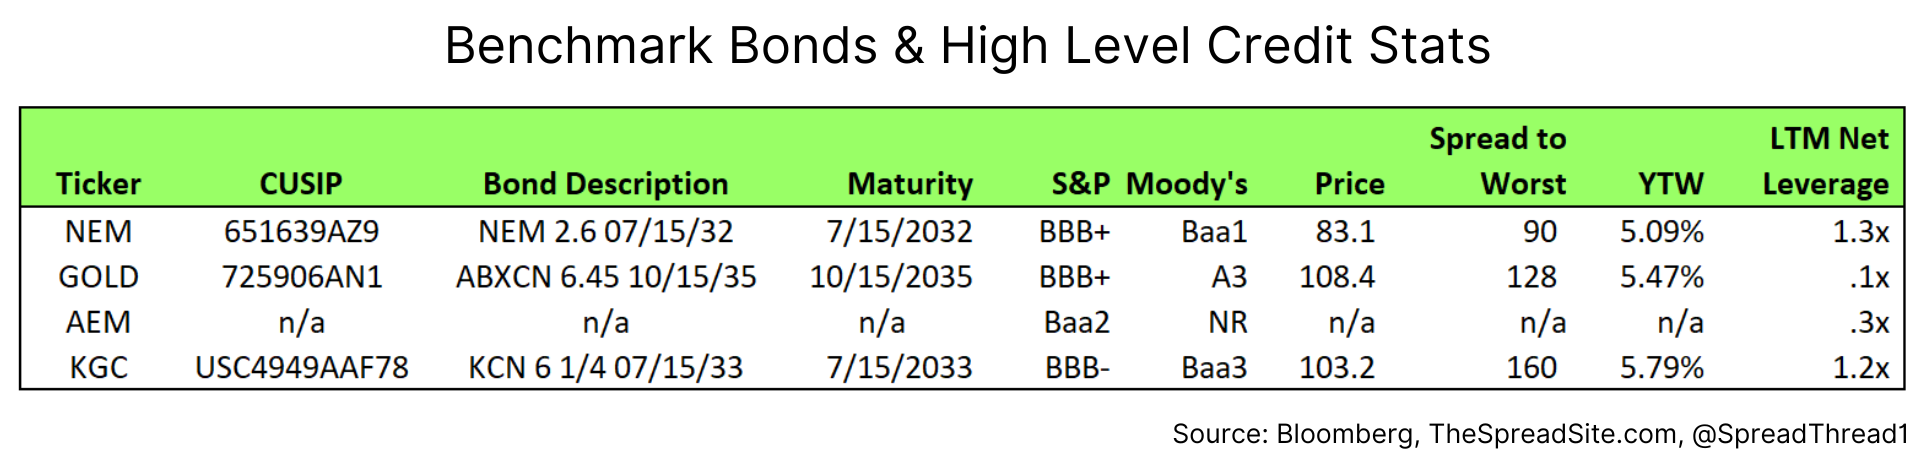
The senior gold miners analyzed above are all investment grade and while we don’t find their bonds all that interesting, a quick credit snapshot is below (Agnico-Eagle does not have bonds outstanding).
Disclosures
Please click here to see our standard legal disclosures.
The Spread Site Research
Receive our latest publications directly to your inbox. Its Free!.
