Part 2: BDCs
Summary
- Business Development Companies (“BDCs”) offer high dividend yields as they make floating rate, high yielding loans to small and mid-sized businesses. However, dividend yield is a flawed valuation measure when looking at the sector. Net Investment Income Yield as well as factors that impact book value are more useful datapoints that we walk through below.
- Getting granular data on underlying loans held by a BDC is very difficult, but we illustrate a number of metrics that are helpful in comparing across the sector while highlighting a few that we find concerning, such as rapidly declining interest coverage for companies in BDC portfolios.
- We cover 11 of the largest BDCs and bifurcate the high and low quality names, in our opinion. We see value in the sector long-term, but have a cautious view currently given tight credit spreads late in a cycle and borrowers that will continue getting squeezed if rates cuts don’t materialize. We think names with successful long-term track records such as ARCC, MAIN and TSLX are ok to own but would wait for spread widening before stepping in on the riskier names.
Introduction
In Part 2 of our High Yielding Equity Series, we look at BDCs - a high yielding, tax advantaged sector of the market. BDCs originate or invest in a portfolio of loans to small and mid-sized, privately held companies (typically below $250mm of value). Loans typically carry yields in excess of broad high yield markets as compensation for the added liquidity risk and smaller size of borrowers, but investors can earn dividend yields in excess of 10% per year.
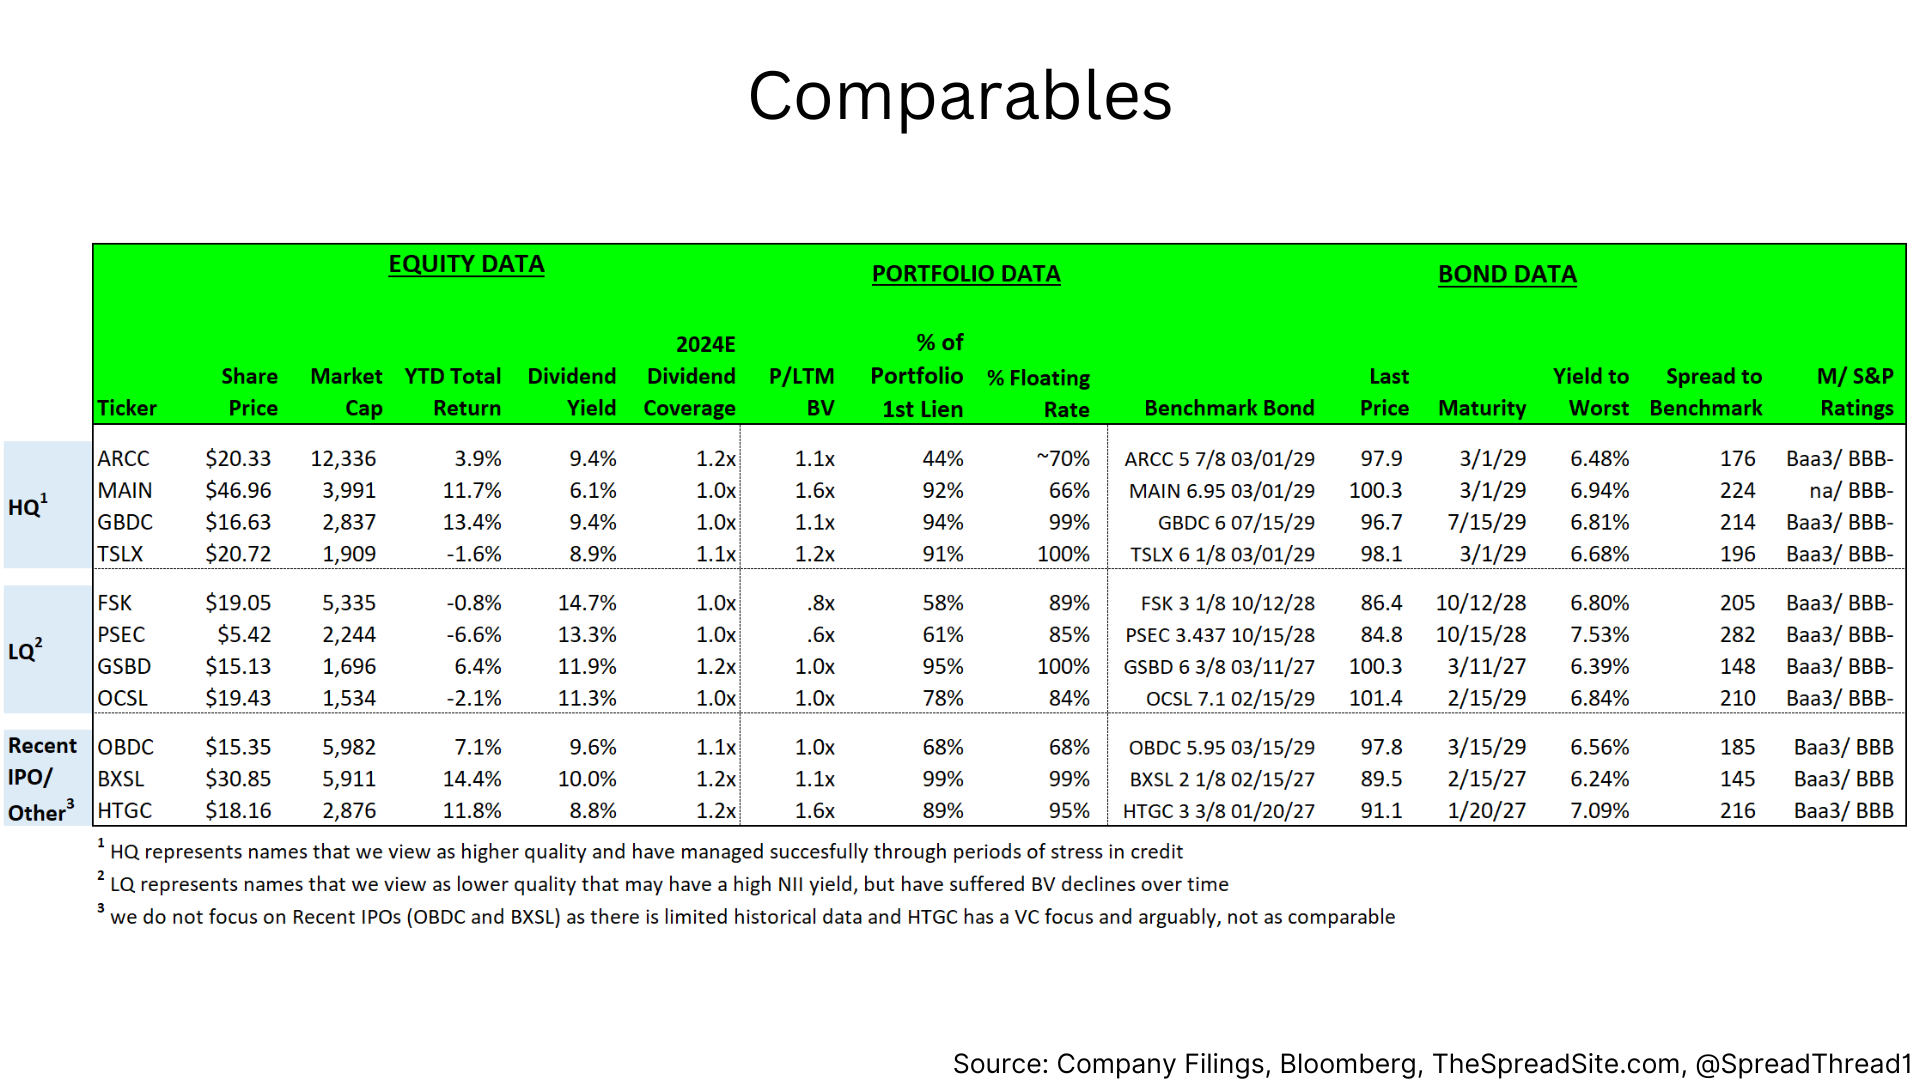
In this report we look at 11 of the largest BDCs (cutoff was ~$1b of market cap) comparing each name across various metrics while analyzing what goes into their yield and total return. Every BDC is slightly different, but we classify them into two general groups based on long-term total returns, book value per share CAGR and portfolio metrics such as % of interest being paid as PIK and non-accruals. But as we discuss below, no single metric tells the whole story.
- High Quality (“HQ”): Ares Capital Corp (“ARCC”), Main Street Capital (“MAIN”), Golub Capital (“GBDC”), and Sixth Street Specialty Lending (“TSLX”)
- Low Quality (“LQ”): FS KKR Capital (“FSK”), Prospect Capital (“PSEC”), Goldman Sachs BDC (“GSBD”), and Oaktree Specialty Lending (“OCSL”)
- Recent IPOs/ Other: Blue Own Capital (“OBDC”) and Blackstone Secured Lending (“BXSL”) have limited historical data and Hercules Capital (“HTGC”) primarily lends to VC companies so we show them in a third section.
Similar to the midstream sector, we do not view dividend yield as an appropriate valuation metric and focus on net investment income yield (“NII Yield”), while also incorporating changes to book value. NII Yield is defined as [Net Investment Income/ market cap] (see Appendix for a calculation example). The combination of both (plus any changes in price to book value (“P/BV”) multiples) provides a total return.
Summing up, we are cautious on BDCs. Credit spreads are very tight, and we would avoid the riskier parts of credit markets (i.e., private credit) this late in a cycle, at these valuations. Leveraged loan borrowers in many cases need rate cuts and will feel the pain if those cuts don’t come. For now, we would stick with higher quality names that have a long-term proven track record. We do see value in BDCs long-term, but would wait for periods of spread widening to own names in the LQ bucket.
BDC Sector Overview
The BDC sector was originally created by the Small Business Investment Incentive Act of 1980 to provide capital to small and midsized businesses. They are tax advantaged, which means taxes are not paid at the corporate level (small state and excise taxes may occur) and income is passed through to investors. At a high-level, the requirements to be regulated as a BDC are as follows:
- Pay out 90% of taxable income in the form of dividends
- Maintain a minimum asset coverage ratio of 150% (total investments at FV/ total debt)
- Maintain at least 70% of investments as “eligible assets”, which generally means debt or equity issued by companies valued at less than $250mm
- Various disclosure requirements on investment portfolio (included in 10Qs & 10Ks), including the status of all loans and investments outstanding
For more detail on BDC structures, this report from Dechert LLP titled “Everything You Need to Know About BDCs” may be helpful.
BDCs primarily make loans to privately held middle market companies and these loans are typically 1st lien giving the BDC control over any restructuring or amendments should the borrower get into trouble. However, BDCs can also be subordinated in the capital structure (i.e. 2nd lien) and are able to invest in the equity of portfolio companies, although this is less common.
Loans are typically structured to “float” above a benchmark interest rate such as SOFR, which means BDCs can do well in a rising-rate environment. For example, a BDC may issue a loan at 3mo SOFR+800bp, which means the borrower would pay the current 3mo SOFR rate of ~5.3% + 8%, or 13.3%.
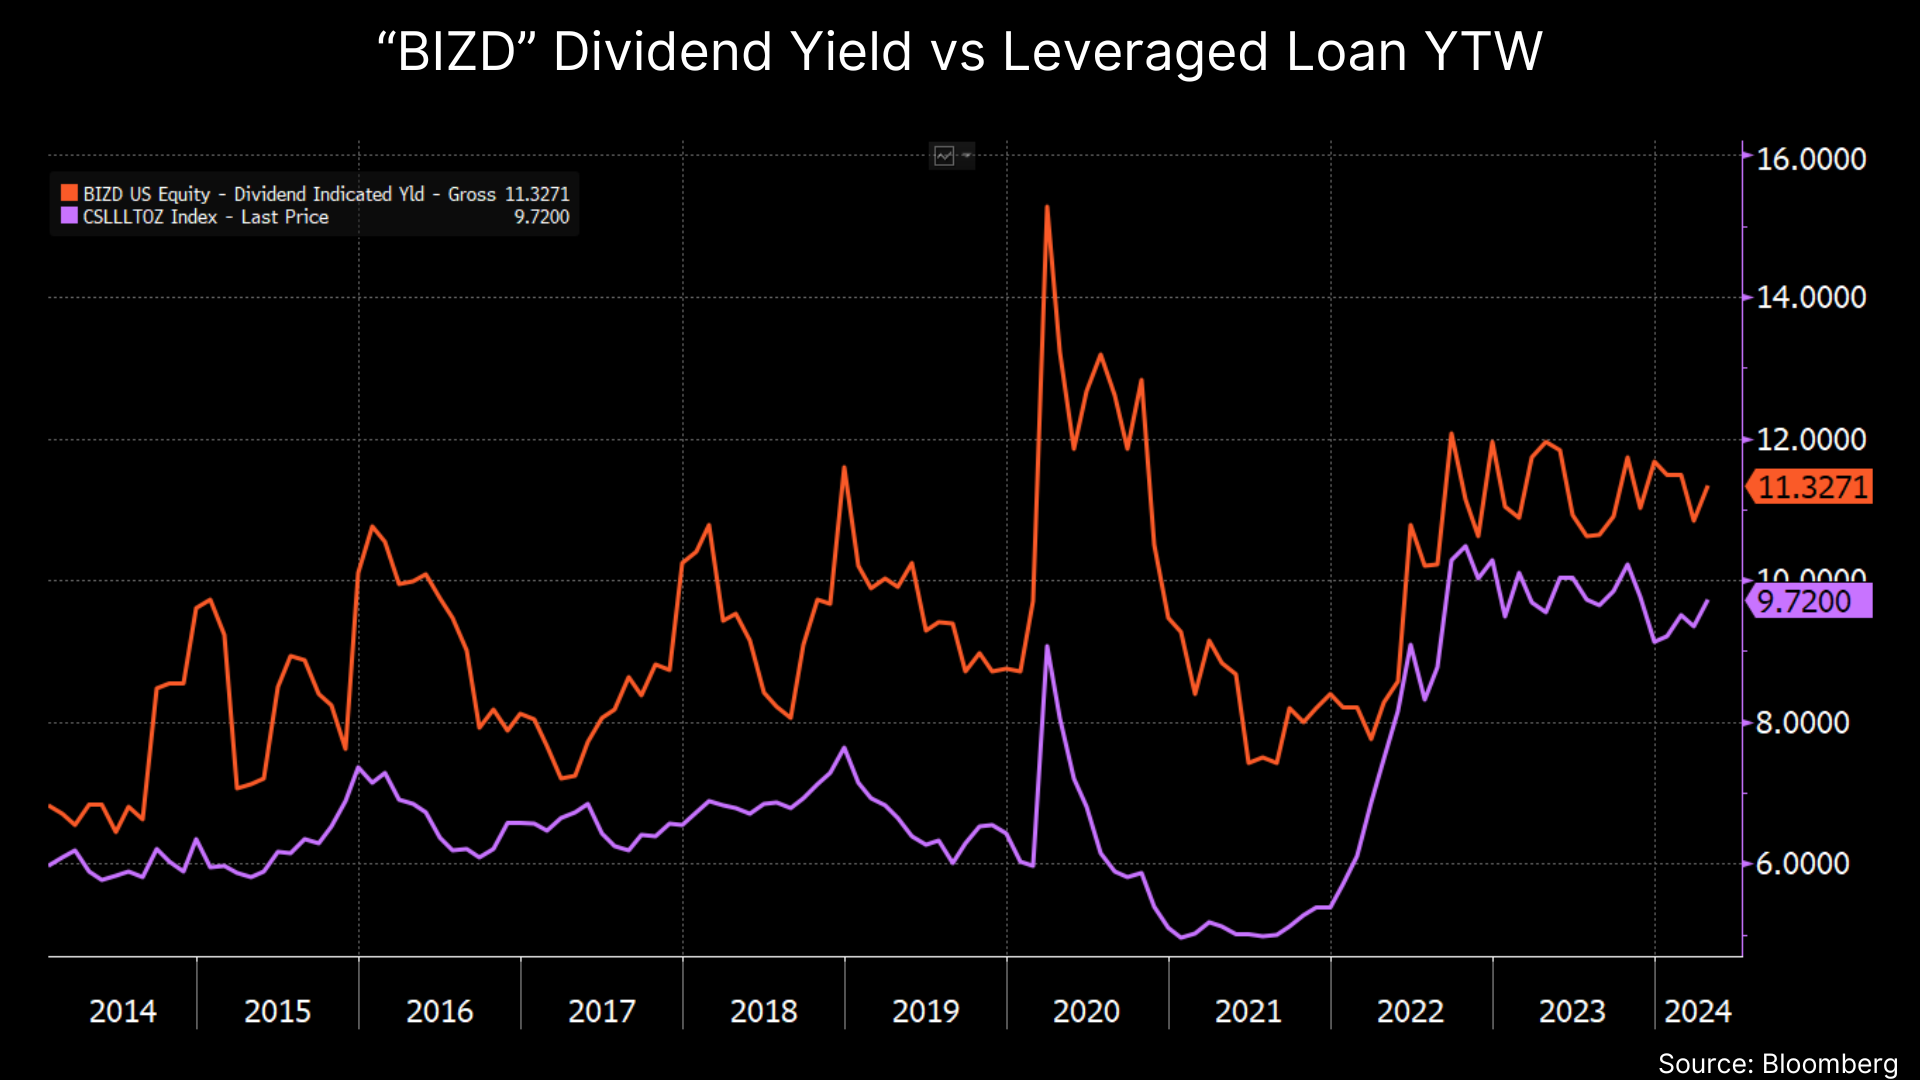
Currently, BDCs have loan portfolios with yields of ~11-15% (disclosure varies), which is higher than the Leveraged Loan (“LL”) index YTW at ~9.7%. We do not have data for overall portfolio yields historically, but the dividend yield of the BDC sector ETF (“BIZD”) serves as a reasonable proxy.
However, dividend yield is only one part of total return. BDC investors must also contend with changes in the value of loans, losses should borrowers default and the price to book value multiple assigned by the market. Usually, BDCs with strong loan underwriting, reasonable cost structures and limited loan losses will trade at higher P/BV multiples which can serve as a positive feedback loop should the BDC want to raise more capital for growth. Obviously, the reverse occurs for weaker BDCs, and if things really go south and a BDC must cut their dividend the share price reaction can be severe.
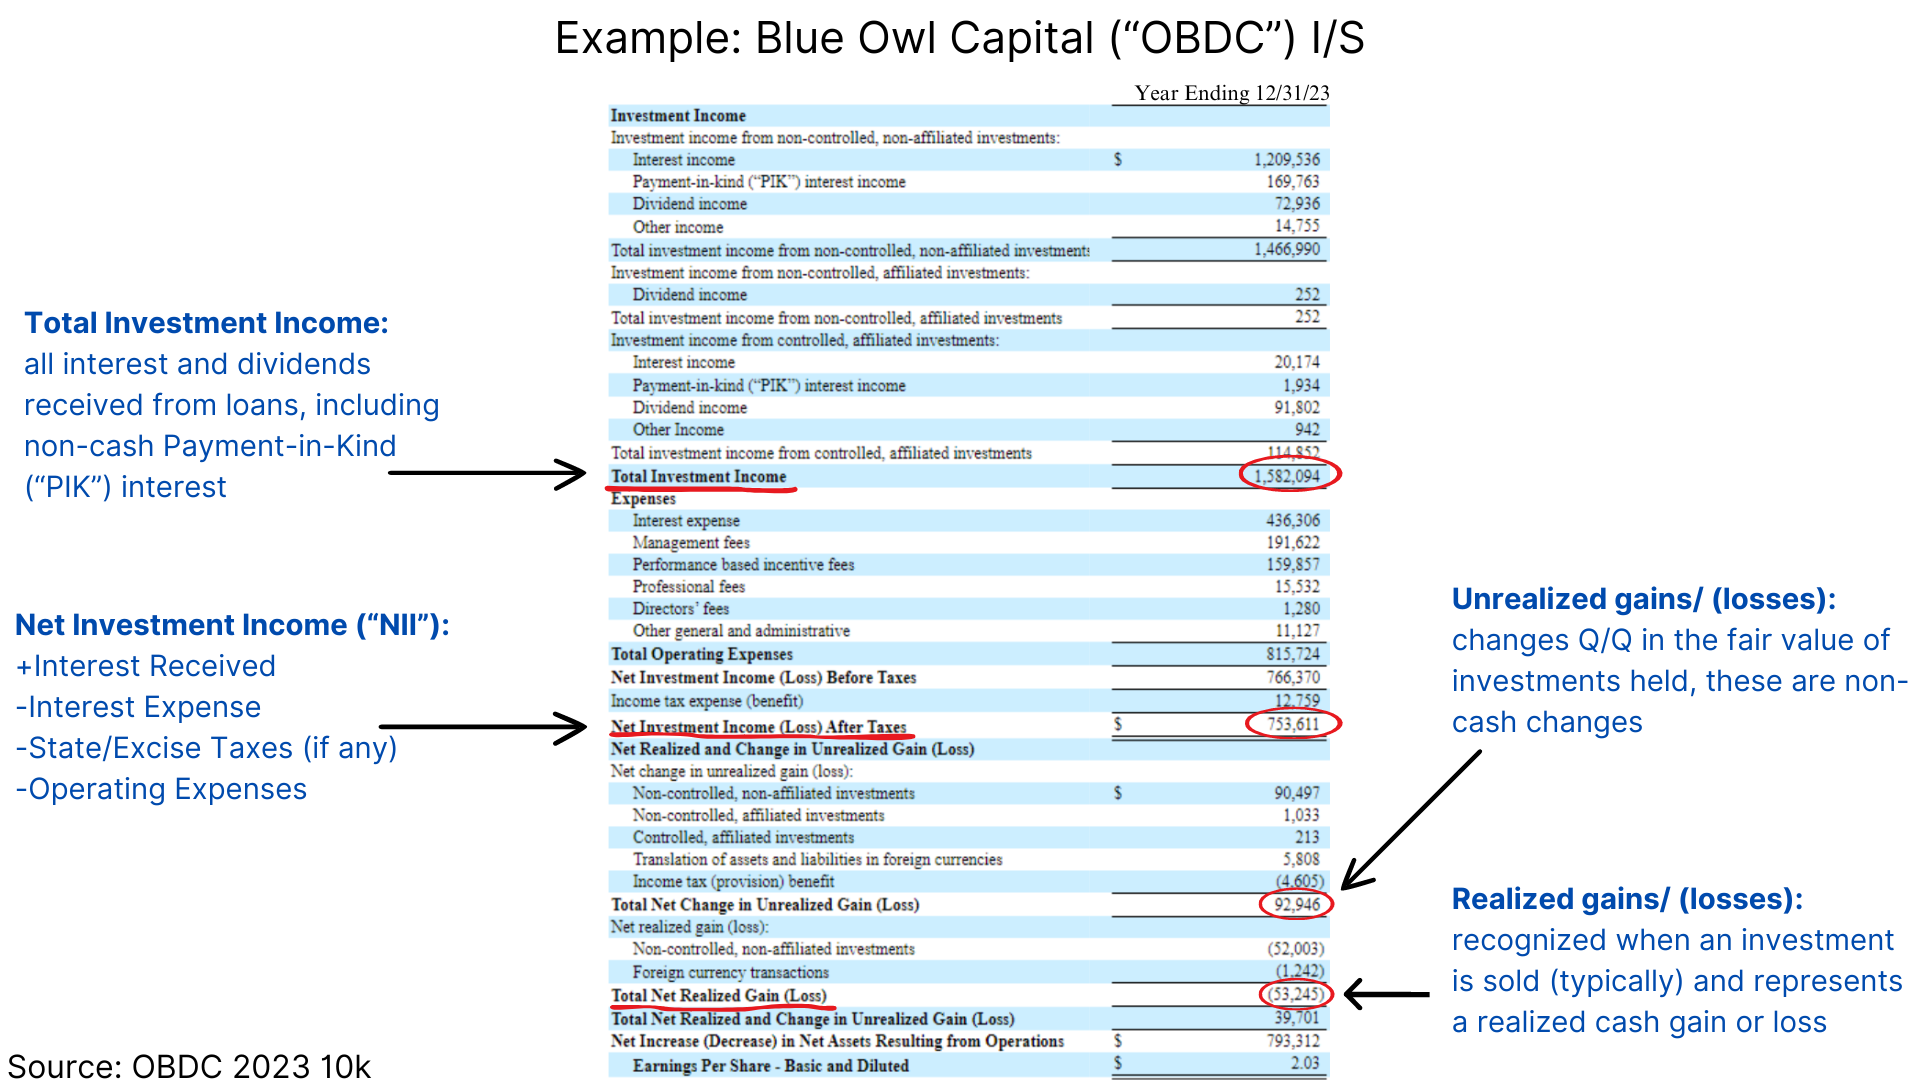
With regards to credit quality of the underlying borrowers, on a quarterly basis BDCs mark their portfolios at “Fair Value” meaning they use internal guidelines to determine the value of each loan without providing much granularity to shareholders. Below we show an example from ARCC’s 2023 10k.
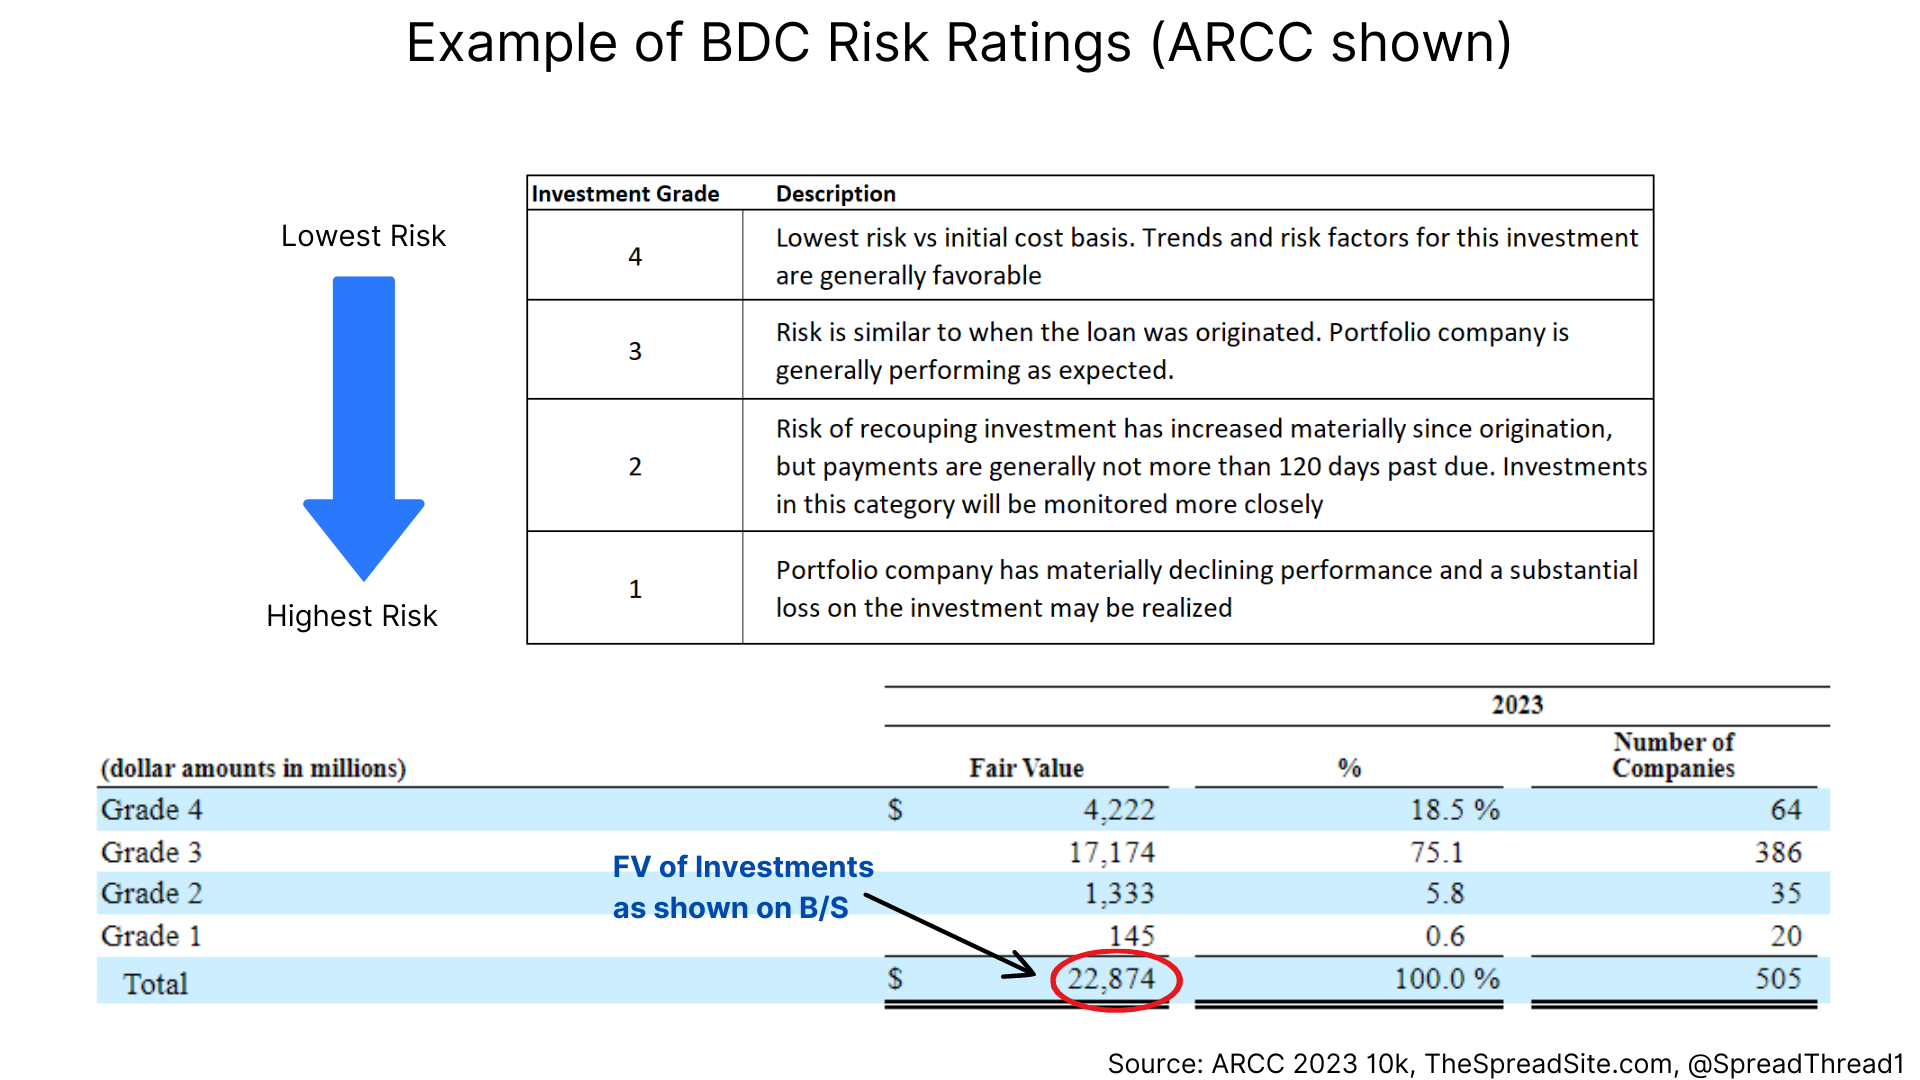
If a loan defaults and is sold or restructured at a loss, this loss reduces book value. Any realized or unrealized gains or losses will flow through to book value and these values are shown below the net investment income line on the income statement (see Appendix for an example).
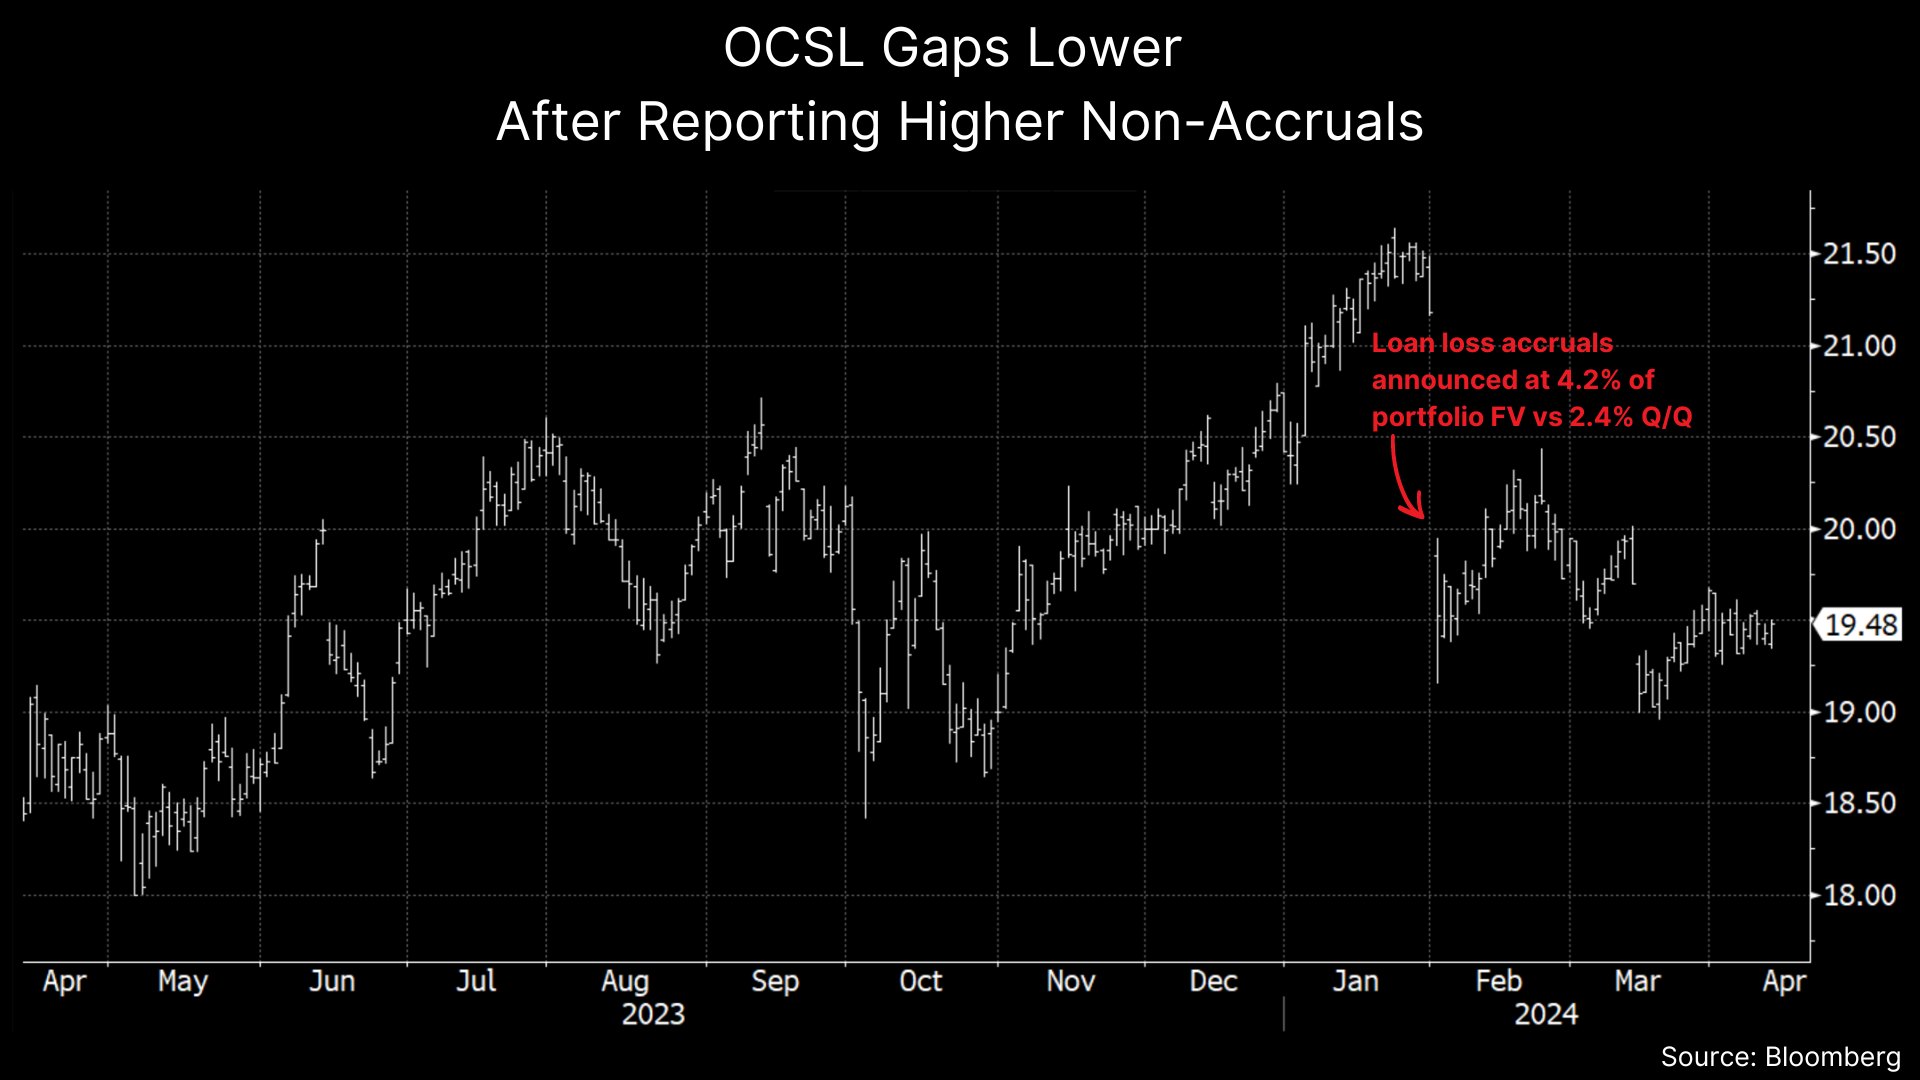
Further, there is no set protocol for putting a loan on non-accrual status (i.e. no longer paying interest and likely to default) and investors can be caught off guard if/when there is a large change in non-accruals. For example, OCSL recently disclosed a large increase in non-accruals sending the stock down ~9%.
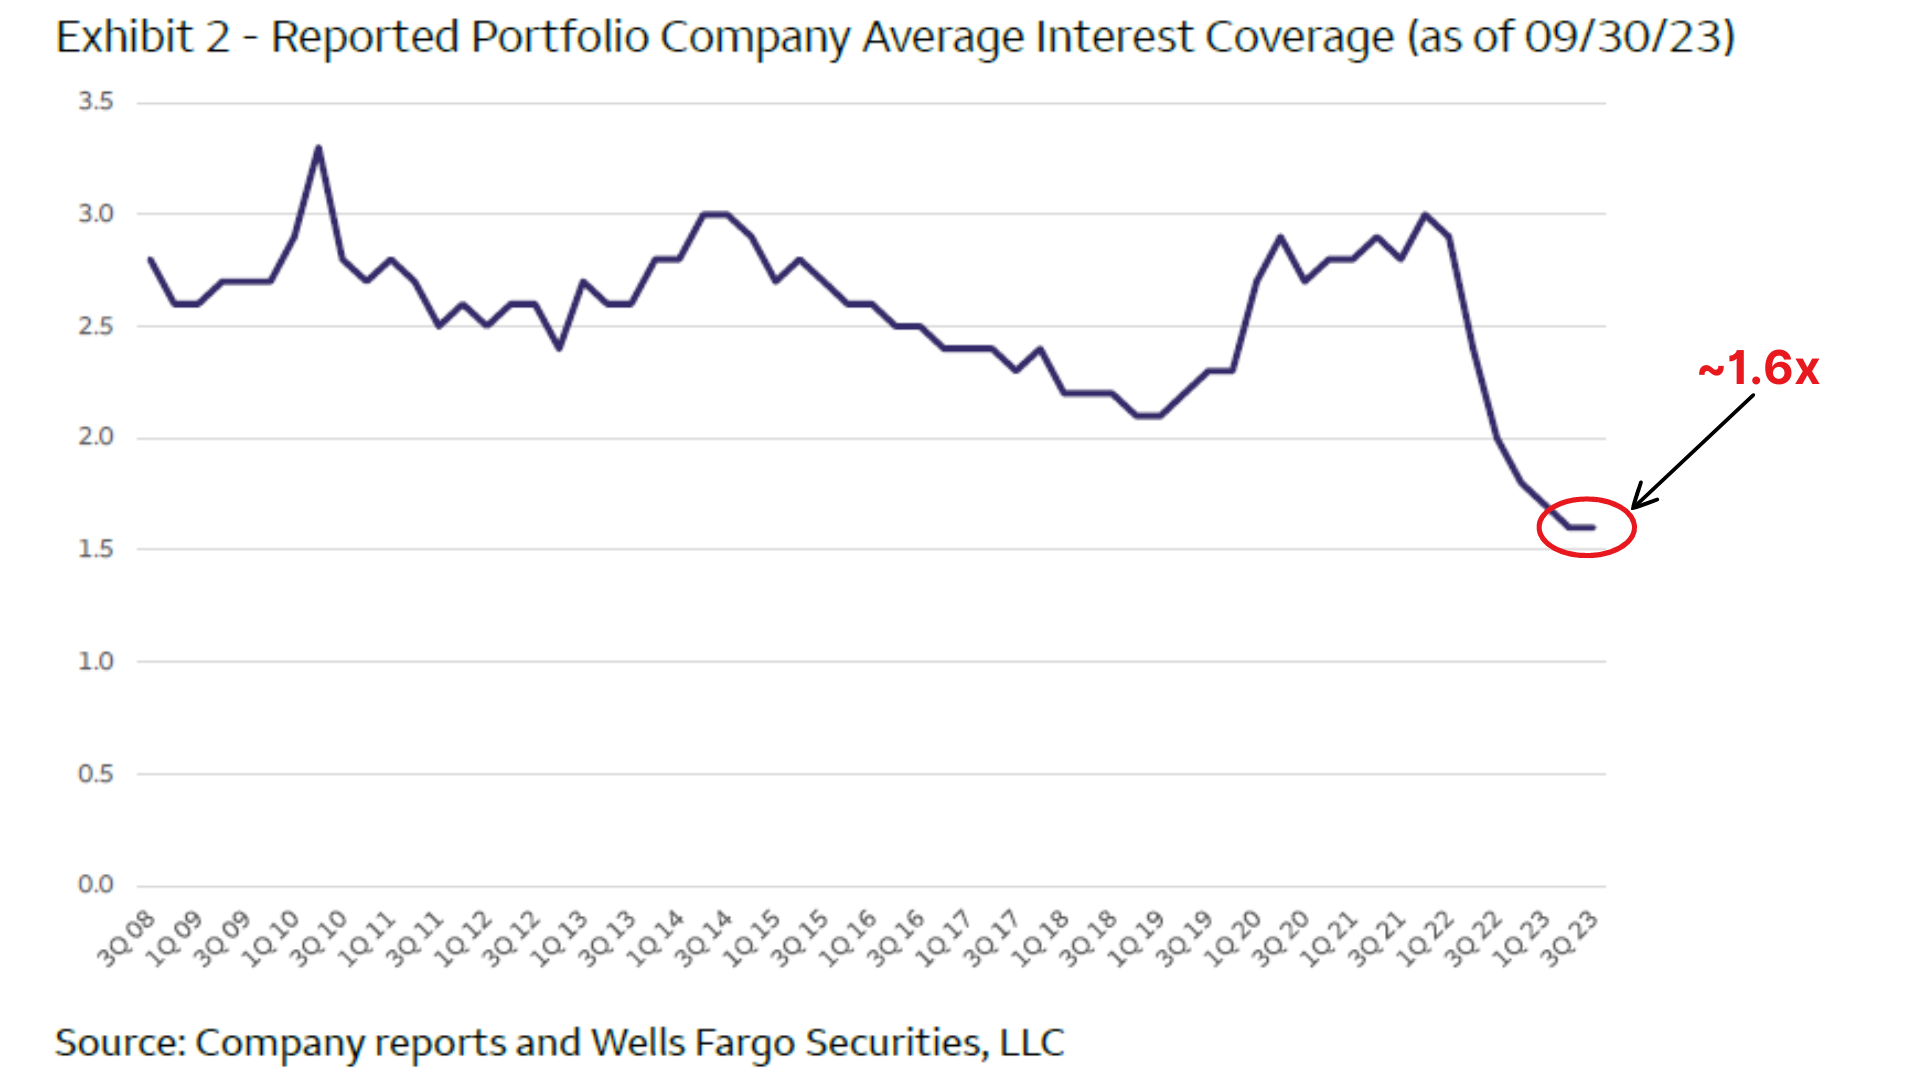
Investor presentations don’t always provide portfolio level metrics such as leverage or interest coverage, which makes it difficult to gauge the reasonableness of fair values on individual loans. One metric that is concerning, however, is the decline in interest coverage (EBITDA/ interest expense). Some BDCs provide an interest coverage ratio, and those who do show a material decline, which makes sense given how much borrowing costs have risen.
In the section below we show a multitude of different metrics that can help investors further bifurcate the sector.
Comparing the Sector in Chart Form
While no single metric is an ultimate indicator of value, putting them together can provide a wholistic picture and help illustrate why some names trade at premiums to BV and vice versa.
The first set of charts (Part 1) shows high level data, but only looking at one metric provides just a piece of the full picture…
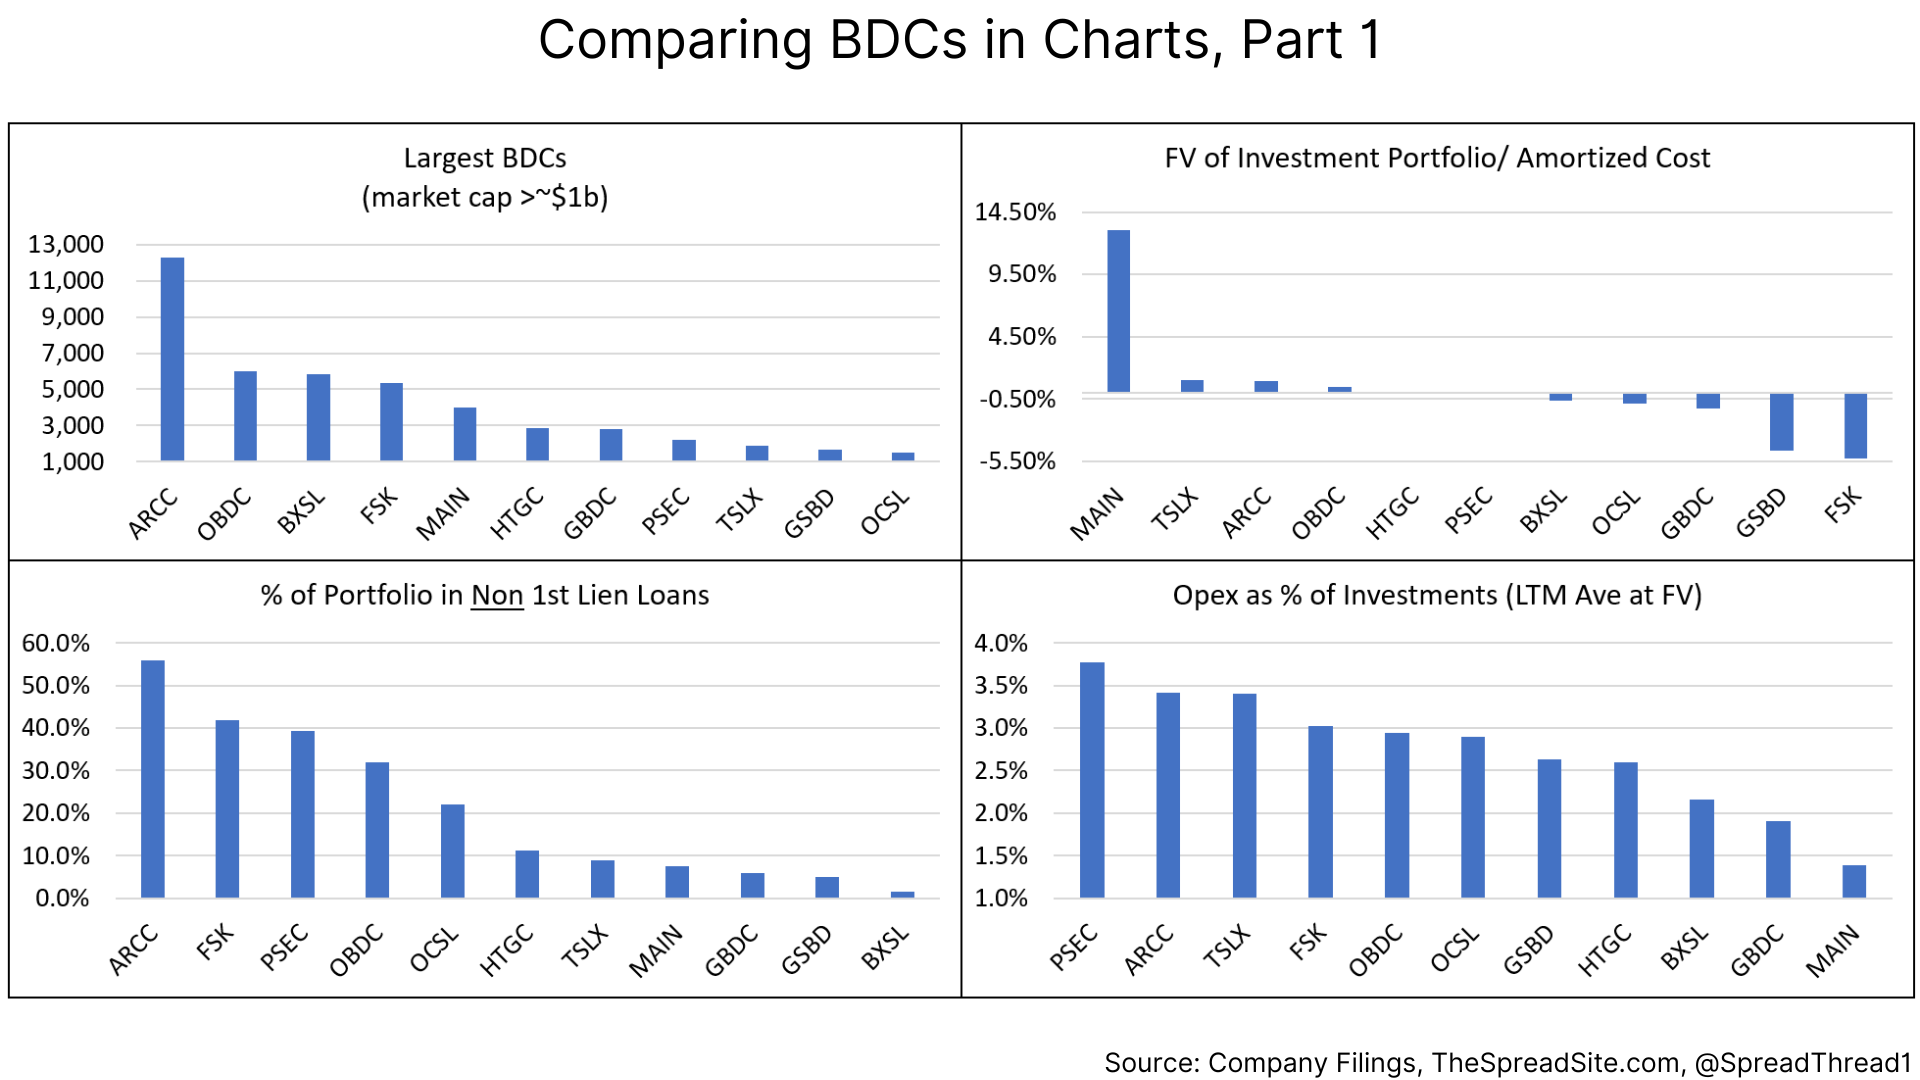
…For example, ARCC and MAIN skew towards more equity investments (higher % in non 1st lien loans), which can be thought of as a negative, but have impressive long-term total returns in contrast to GSBD which has mostly 1st lien loans and high yields, but subpar total returns.
As is typical in credit, very high yields often signal riskier underlying borrowers and higher default rates as is the case with FSK, GSBD and OCSL shown below. Since there is not a standard requirement for putting a loan on non-accrual status, this metric by itself can also be misleading.
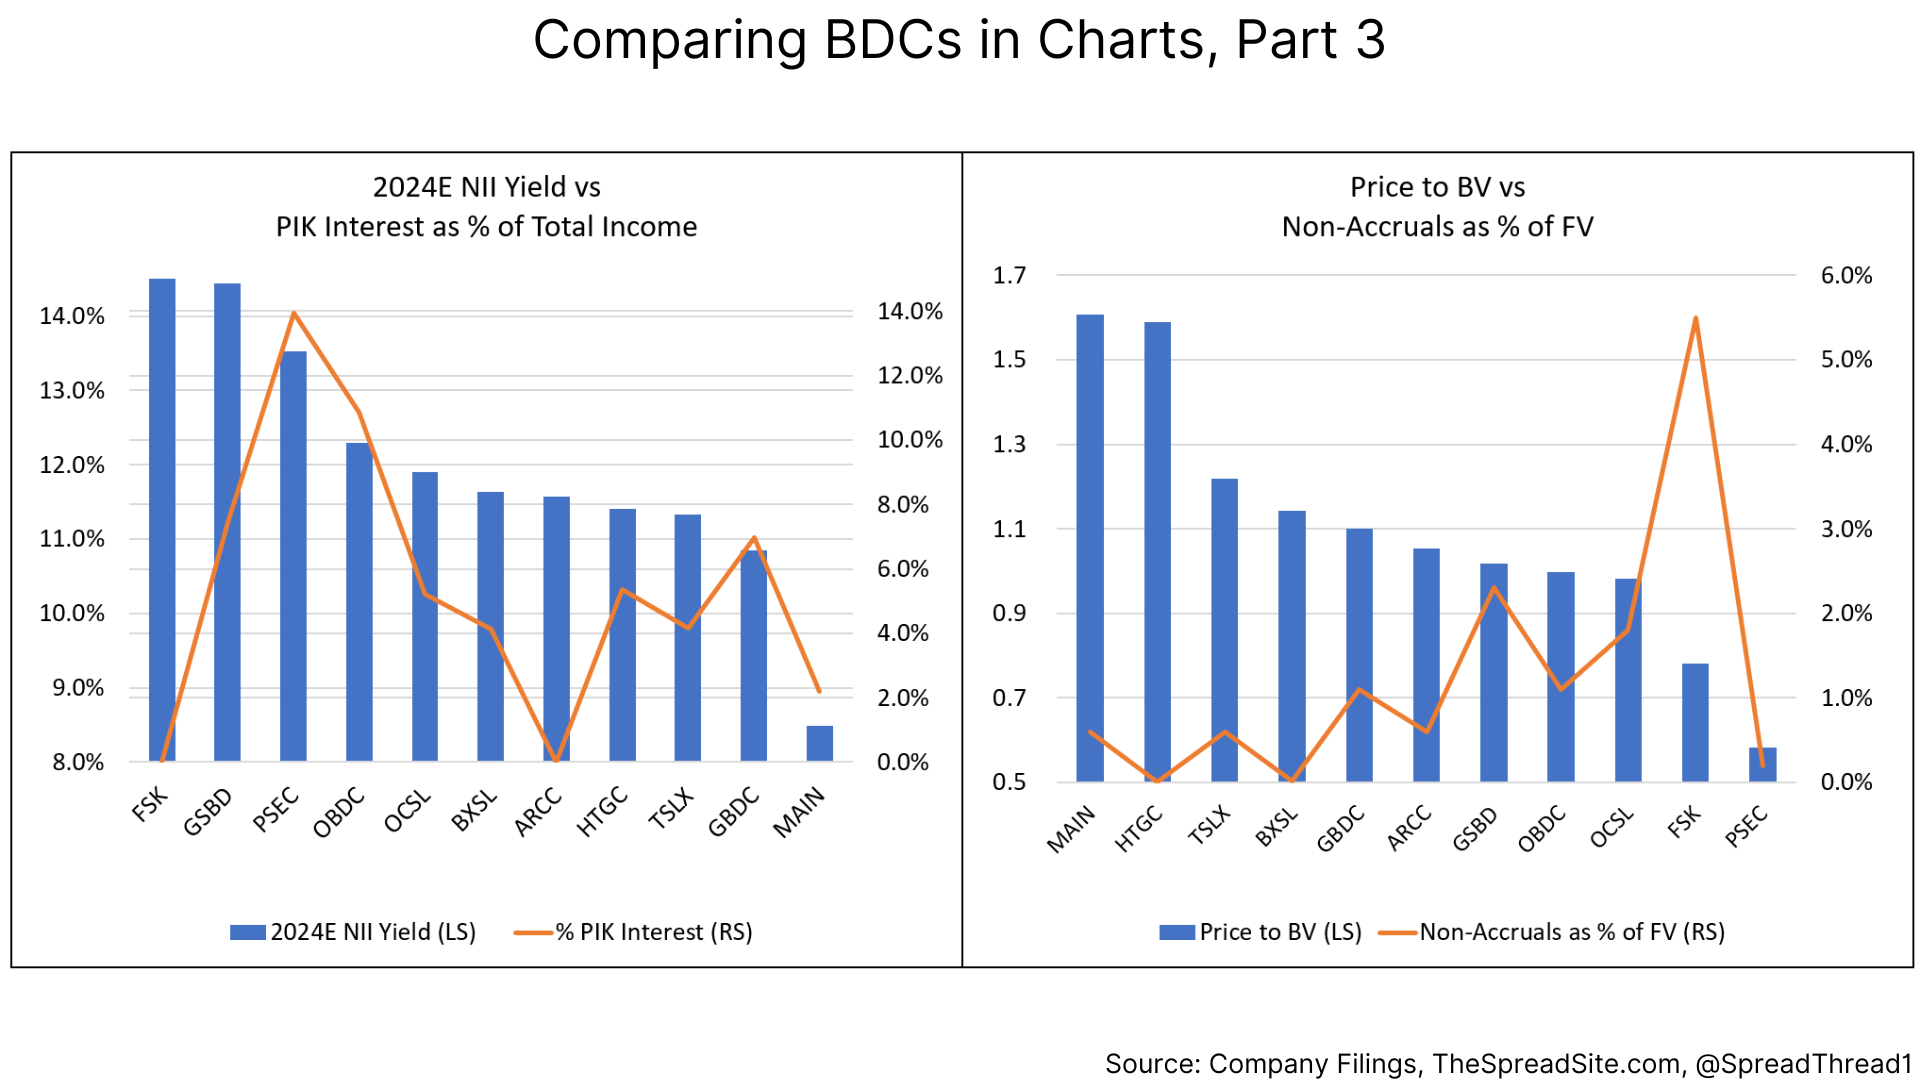
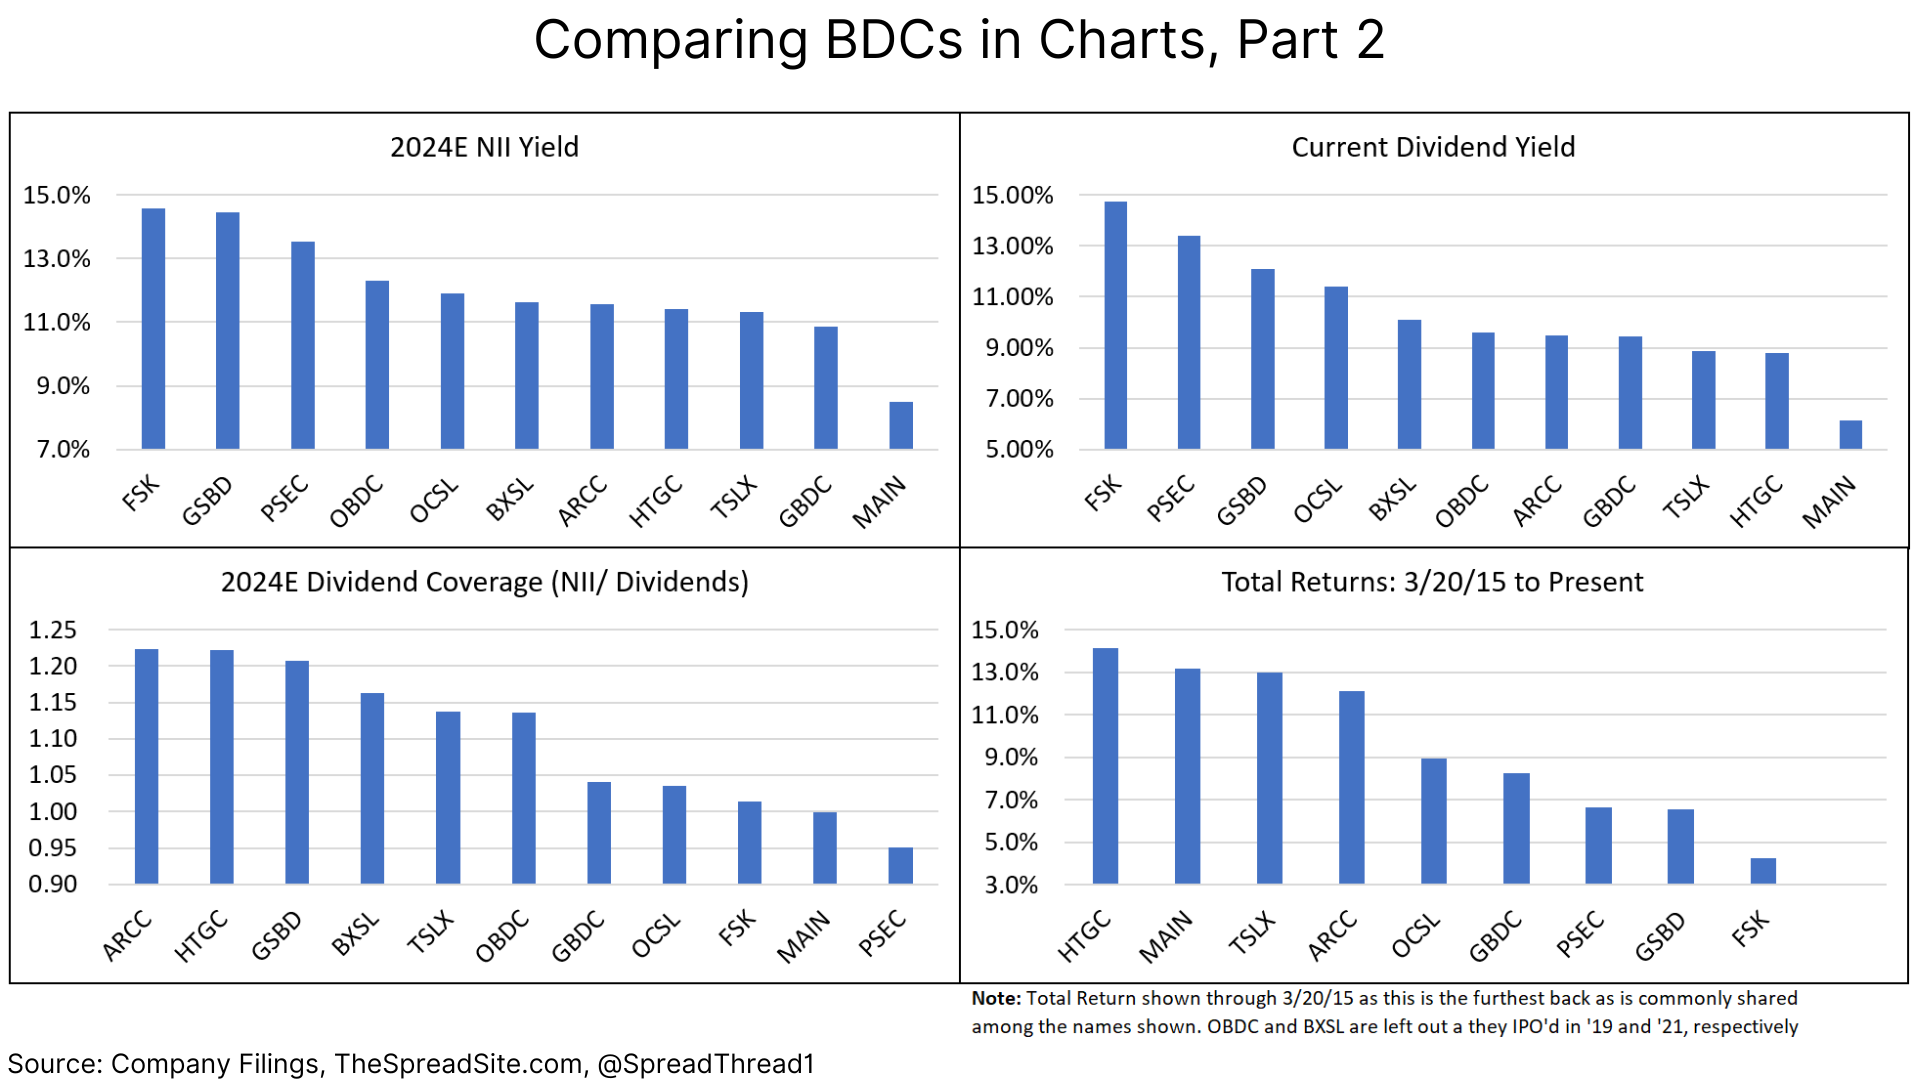
As an example of assessing multiple metrics to get a full picture, we note the following for PSEC even though they have very few loans on non-accrual:
- 40%+ of their portfolio is in non 1st lien debt
- Their expenses as % of total assets is highest among the sample set
- ~13.5% of their total income is paid in the form of PIK
- They have a sub 1x dividend coverage ratio
Consequently, it is not surprising the equity trades at the lowest P/B multiple among the names highlighted.
BDC Yield
When analyzing total return for corporate credit, income is only part of the equation. One must also account for defaults and recoveries. The same is true for BDCs where dividend yield is only part of the equation as any realized/unrealized gains/(losses) will flow through to book value and impact total return.
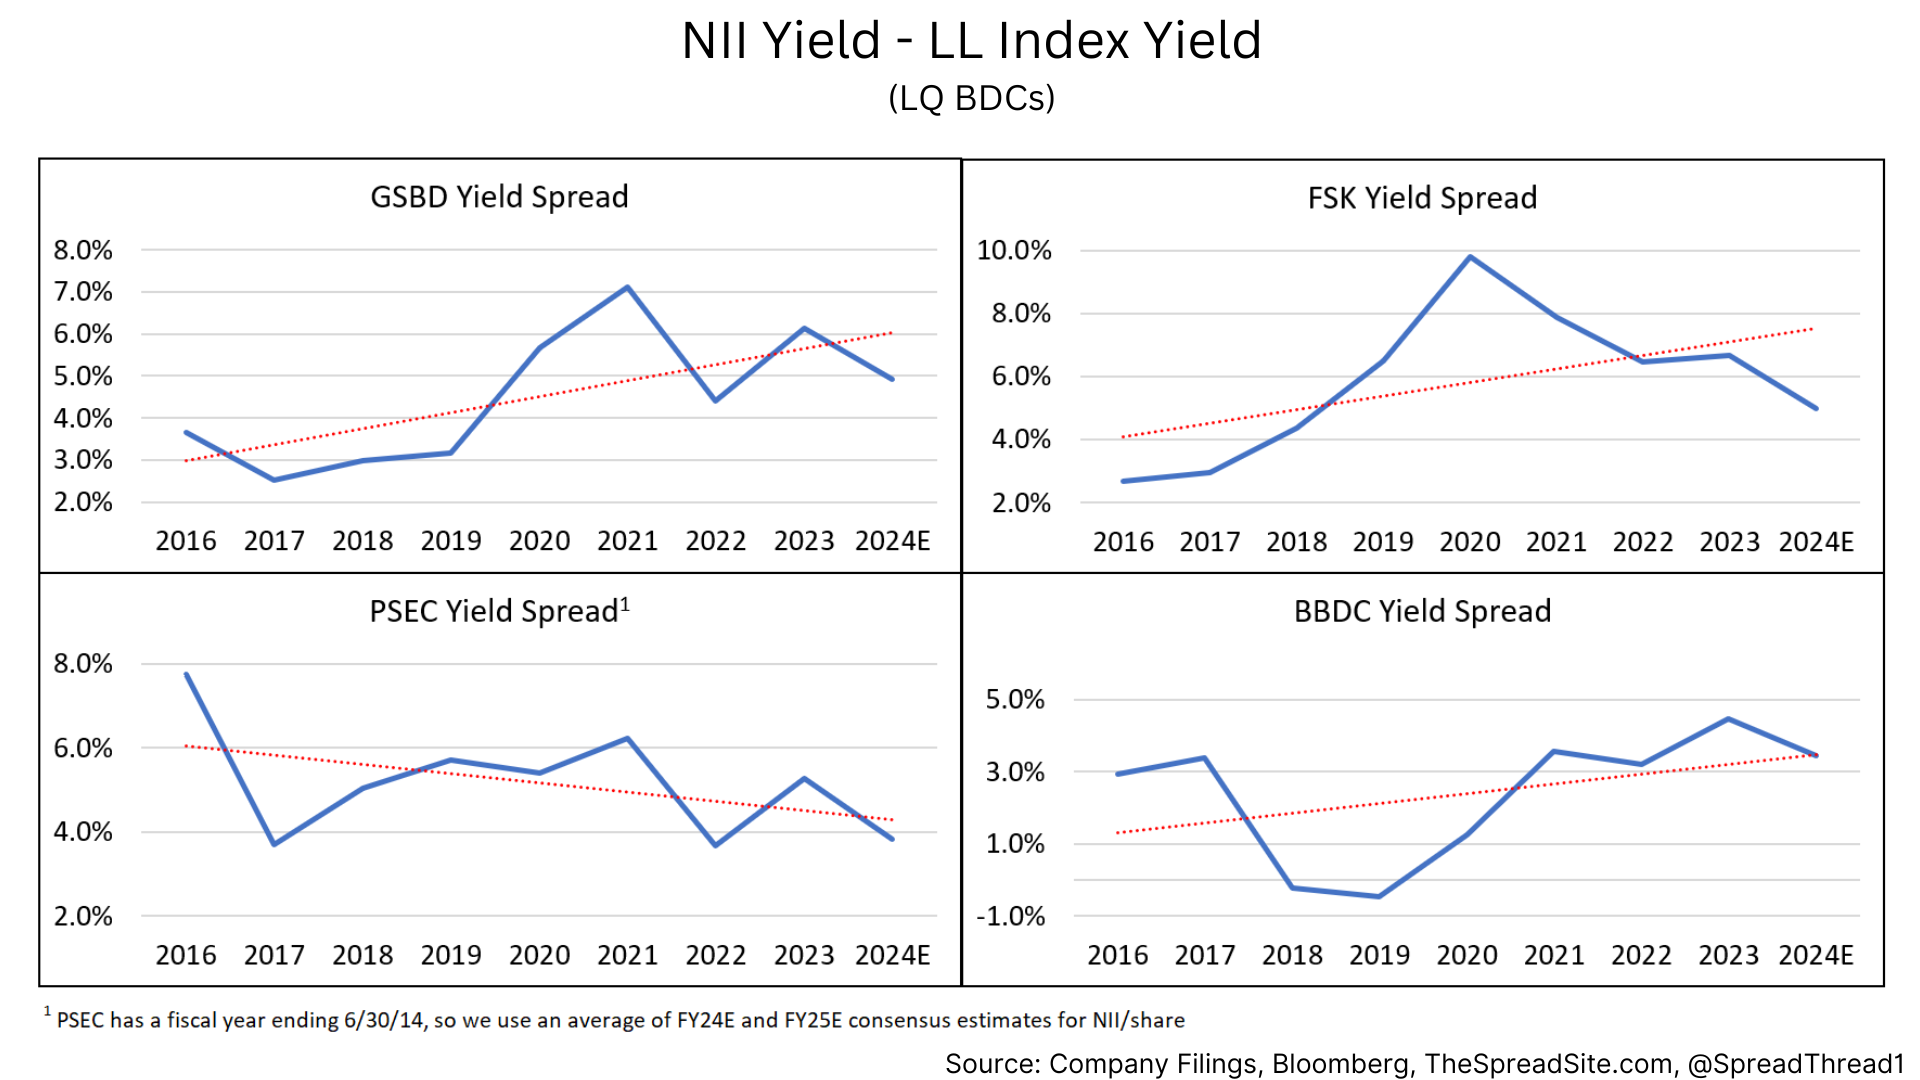
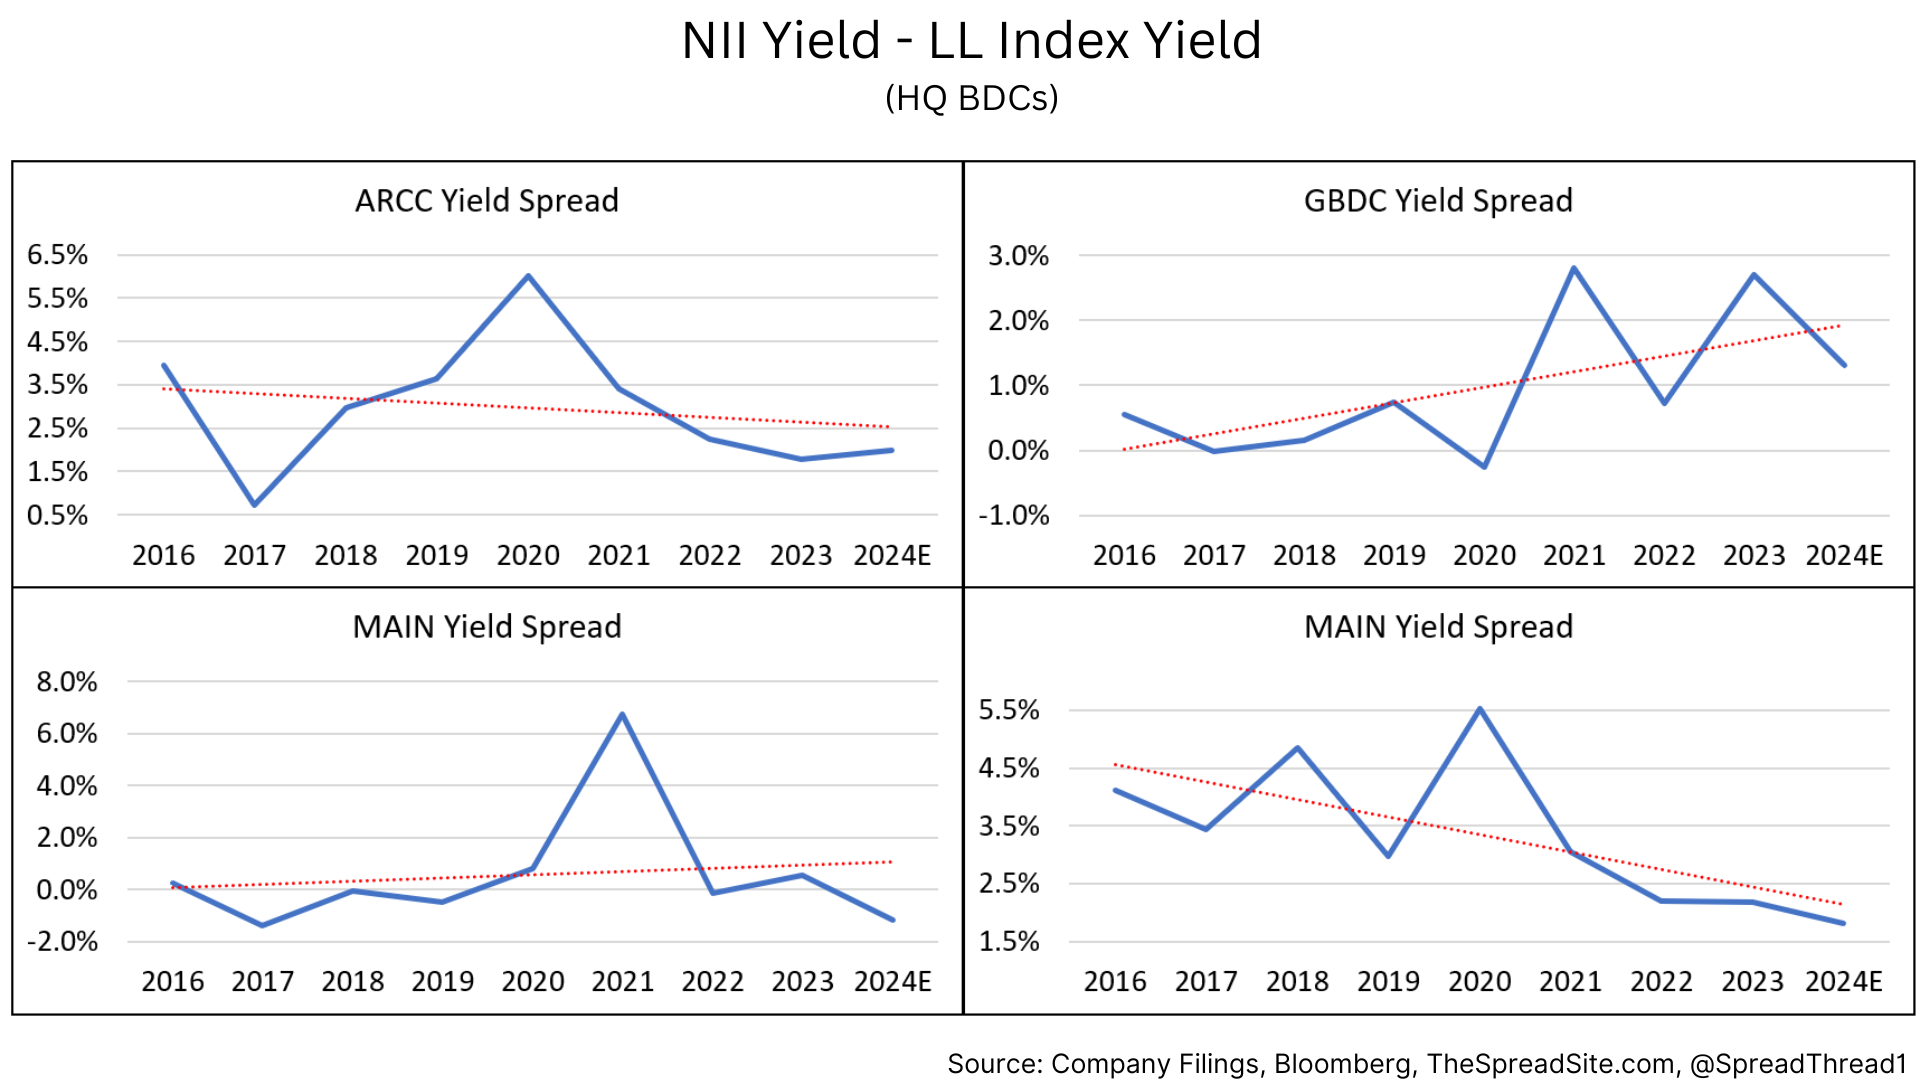
As a shareholder of a BDC, NII yield is ultimately the spread income used to pay dividends. While payout ratios can vary slightly, this metric serves as a better starting point for current yield and can be compared with the yield on the liquid Leveraged Loan Index (BDC NII yield should trade wide to the LL index given illiquidity and arguably worse credit quality).
Not all NII yield is equal, however, as the interest & dividend income received by a BDC comes from many different borrowers of varying credit quality (and increasingly is coming in the form of PIK interest). Therefore, estimating total return must incorporate NII yield AND changes in book value.
As mentioned, BDCs do not provide granularity on the credit quality of individual borrowers and historical data is limited across the sector. Therefore, it is very difficult to forecast default rates and recoveries as is commonly done with broad IG/HY and leveraged loan markets. What is helpful, in our view, is to look at historical performance (to the extent available) and portfolio data of each BDC to get a sense of lurking credit problems that may impact book value.
In the table below we illustrate the point in a few ways.
- The high quality (“HQ”) names, on average, have lower NII yields but significantly more stable book values over time (yellow section). As an example, we show how the names performed during a modest (and somewhat recent) spread widening episode – from Oct 2018 to Jan 2019 (far right section of the chart).
- The low quality (“LQ”) names have high NII yields, but a larger portion of PIK interest, higher non-accruals and long-term declines in book value (peach section).
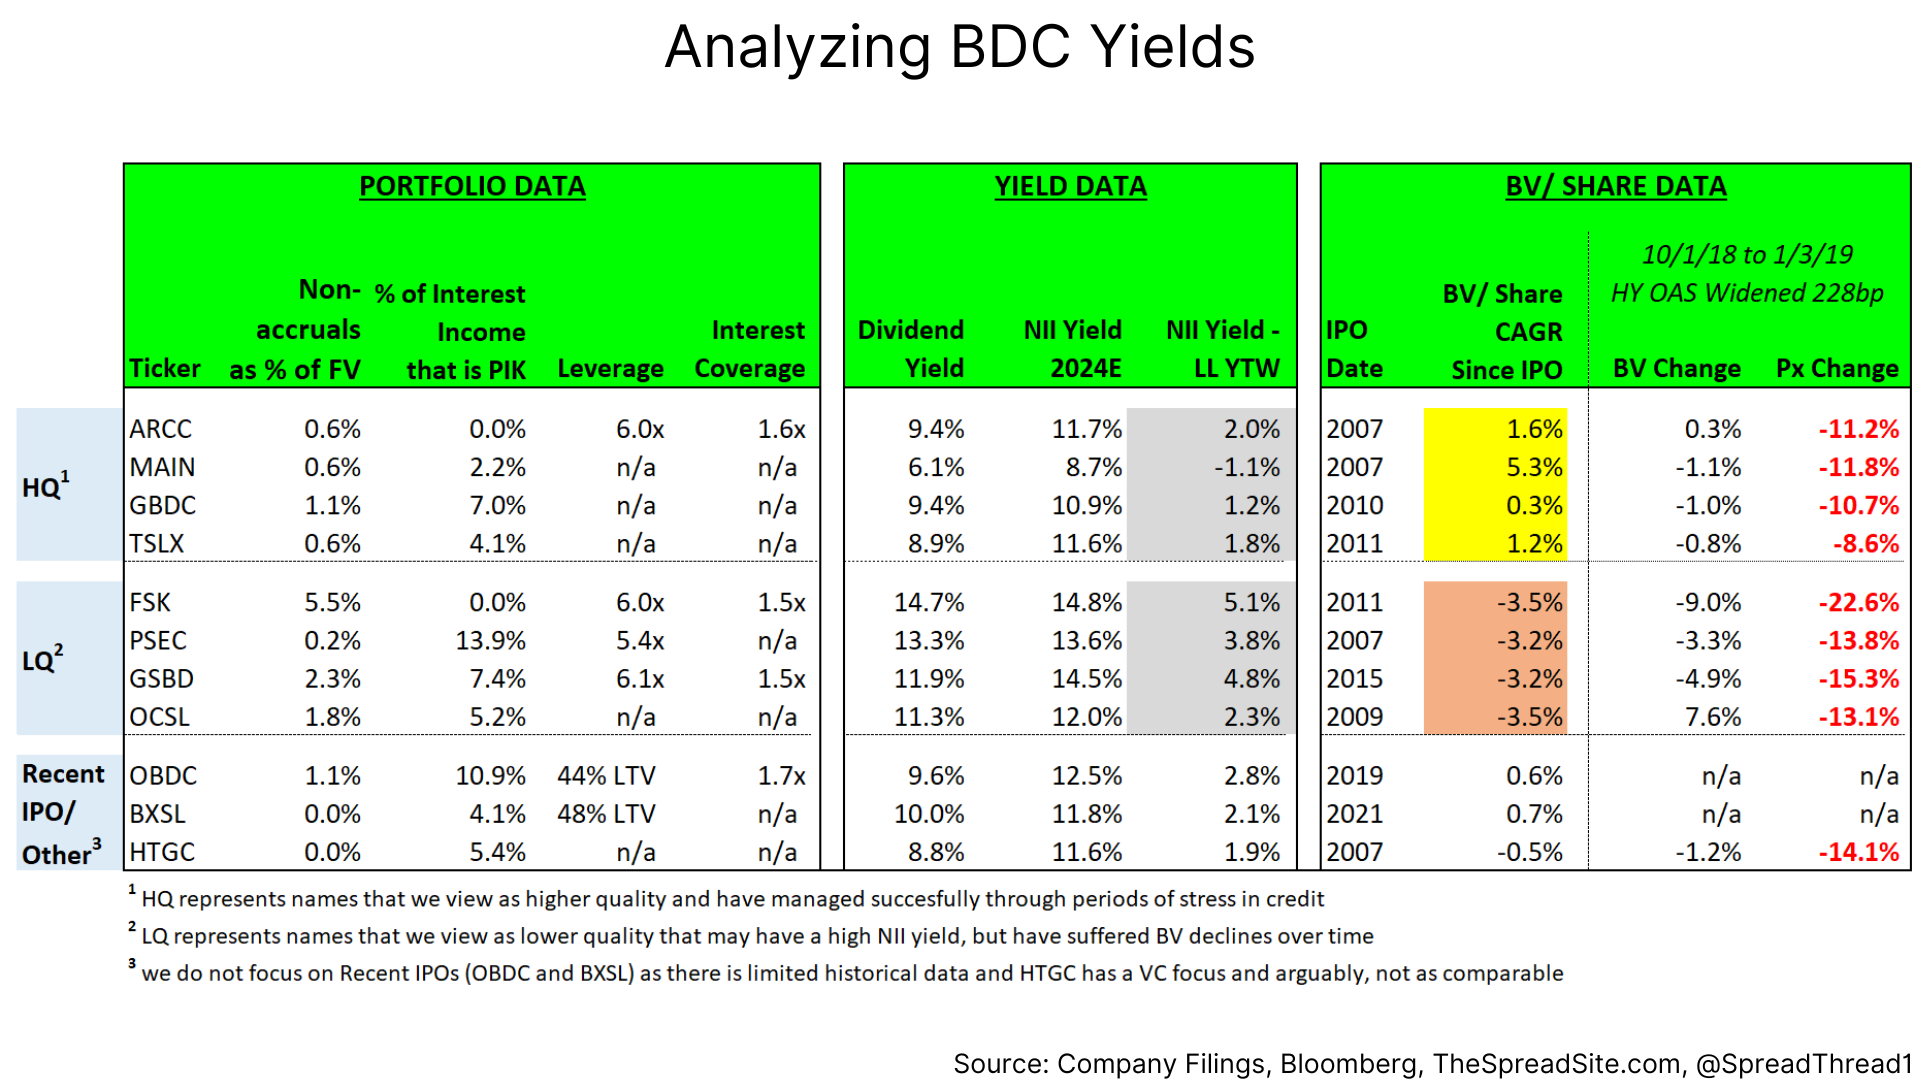
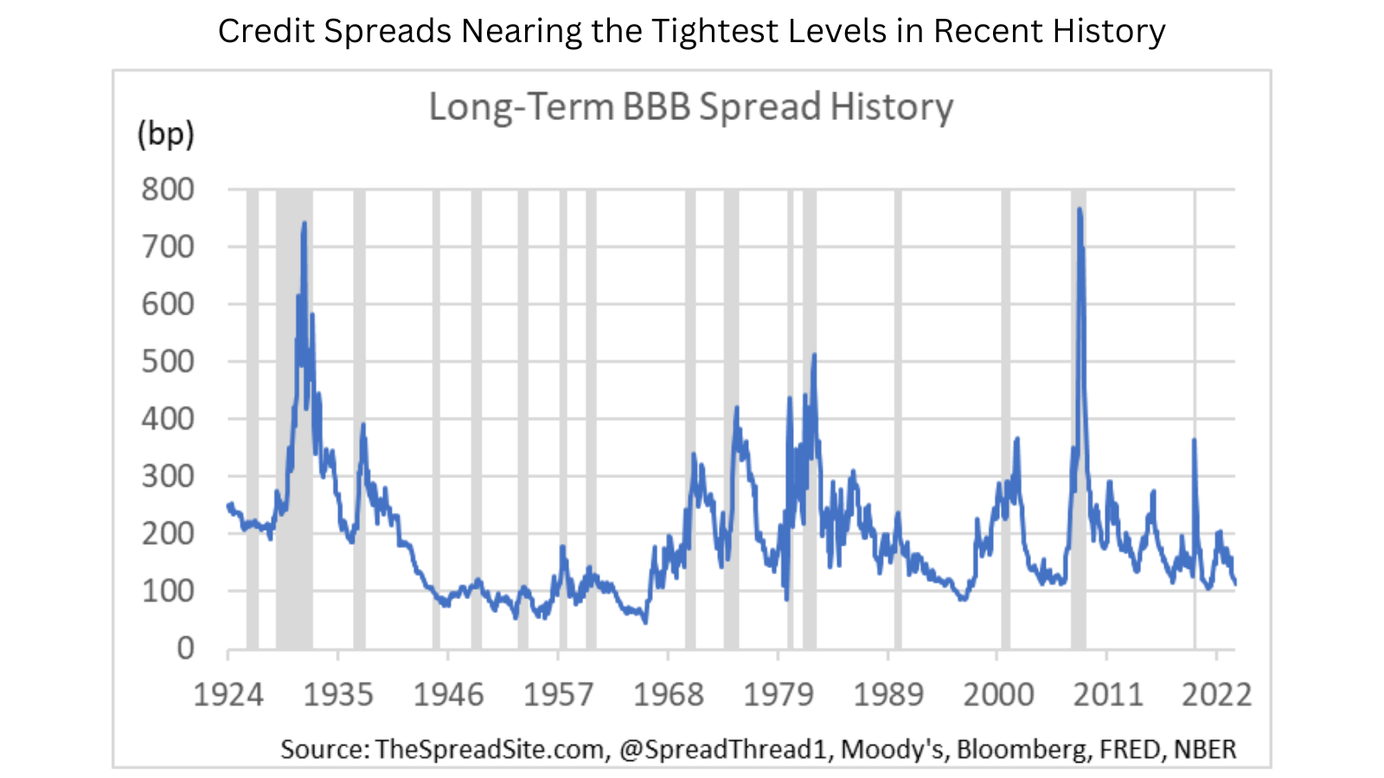
While the LQ names have NII yields well above the LL Index (grey section), we are hesitant to own these names for two reasons. 1) We would avoid the riskier parts of credit markets (i.e., higher risk names in the private credit sector) given very tight overall spreads and our view that markets are late cycle. 2) Along the same lines, higher yields for these names may signal credit issues to come.
For those who want exposure to the sector, we would stick with higher quality names. However, even for this cohort, spreads relative to the LL index are tight vs history. Additionally, while BDCs have benefited from rising rates, we believe underlying borrowers are feeling the squeeze from dramatically higher borrowing costs as indicated by low interest coverage ratios.
Conclusion
For now, we have a cautious view on BDCs in aggregate. Credit spreads remain very tight, credit quality has weakened, and we do not think this is the time in the cycle to make a levered bet on one of the riskier parts of credit markets (private credit). While overall portfolio yields are high partly due to high short-term benchmark interest rates, the flipside is that borrowers are getting squeezed creating default risks down the line. Within the BDC sector, we believe there are a few high-quality companies that have shown their lending skill over long periods of time. For those who want exposure to the sector today, we would stick with ARCC, MAIN and TSLX. We do see value in the sector long-term, but would wait for periods of spread widening to own risker names.
Appendix
The metrics listed above are explained in further detail below:
- Total Investment Income: As benchmark interest rates rise, BDCs receive higher coupon income which is passed through to investors after interest expense and operating costs. However, as PIK income rises there could be mismatches between cash interest received and cash dividends paid out.
- Net Investment Income (“NII”): This is generally the income available to pay dividends to shareholders. Ultimately, BDCs pay out a percentage of “taxable income” which can be calculated differently than NII. However, most investors will focus on NII as a proxy for cash flow available to pay dividends.
- Unrealized gains/ (losses): As BDCs mark their portfolios according to internal valuation standards, any unrealized gains/ (losses) will flow through the income statement to the balance sheet. Large or accelerating unrealized losses will typically foreshadow realized losses and/or other problems in the portfolio.
- Realized gains/ (losses): While unrealized gains/ (losses) can reflect modest changes in market dynamics (i.e. wider credit spreads), they are non-cash changes. To the extent BDCs have significant realized gains above their cost basis, the proceeds can be used to make additional loans and increase book value. In the reverse, cash losses reduce income received and the capital base used by the BDC to make loans.
Disclosures
Please click here to see our standard legal disclosures.
The Spread Site Research
Receive our latest publications directly to your inbox. Its Free!.


