Ford and GM: Cheap For a Reason
Summary
- Recent share price underperformance for Ford and GM is driven in part by a cost structure that is moving structurally higher after recently signing a new UAW labor contract. In addition, while each company is transitioning to higher electric vehicle (“EV”) production, fundamentals in this segment are softening, leading to an uncertain path to profitability.
- While optically “cheap,” we view F and GM as value traps even though their implied auto production businesses are being valued at <1.5x EBITDA. These companies are highly capital intensive, operate in extremely competitive markets and generate relatively low margins over a cycle. They are also highly complex with confusing financial statements that need to account for line items such as JVs, pension and OPEB (healthcare) expenses. This leads to structurally low multiples that are deserved, in our view.
- Additionally, we think the transition to EVs is going to drive uncertainty and weigh on valuations for some time. And we believe this is not the time in the economic cycle to own highly cyclical business even at optically “cheaper” valuations. We think entry points closer to high single digits for Ford and low $20s for GM are closer to a “floor” and provide adequate compensation for the risks inherent in the automotive business.
- Despite these clear headwinds, the automotive segments of F and GM carry very little short to medium-term credit risk, in our view, given zero net debt, substantial liquidity, and flexibility on cash uses in a downturn. While BBB spreads are tight, we think short-dated yields of ~6.4% for F and 5.6% for GM are reasonably attractive.
Introduction
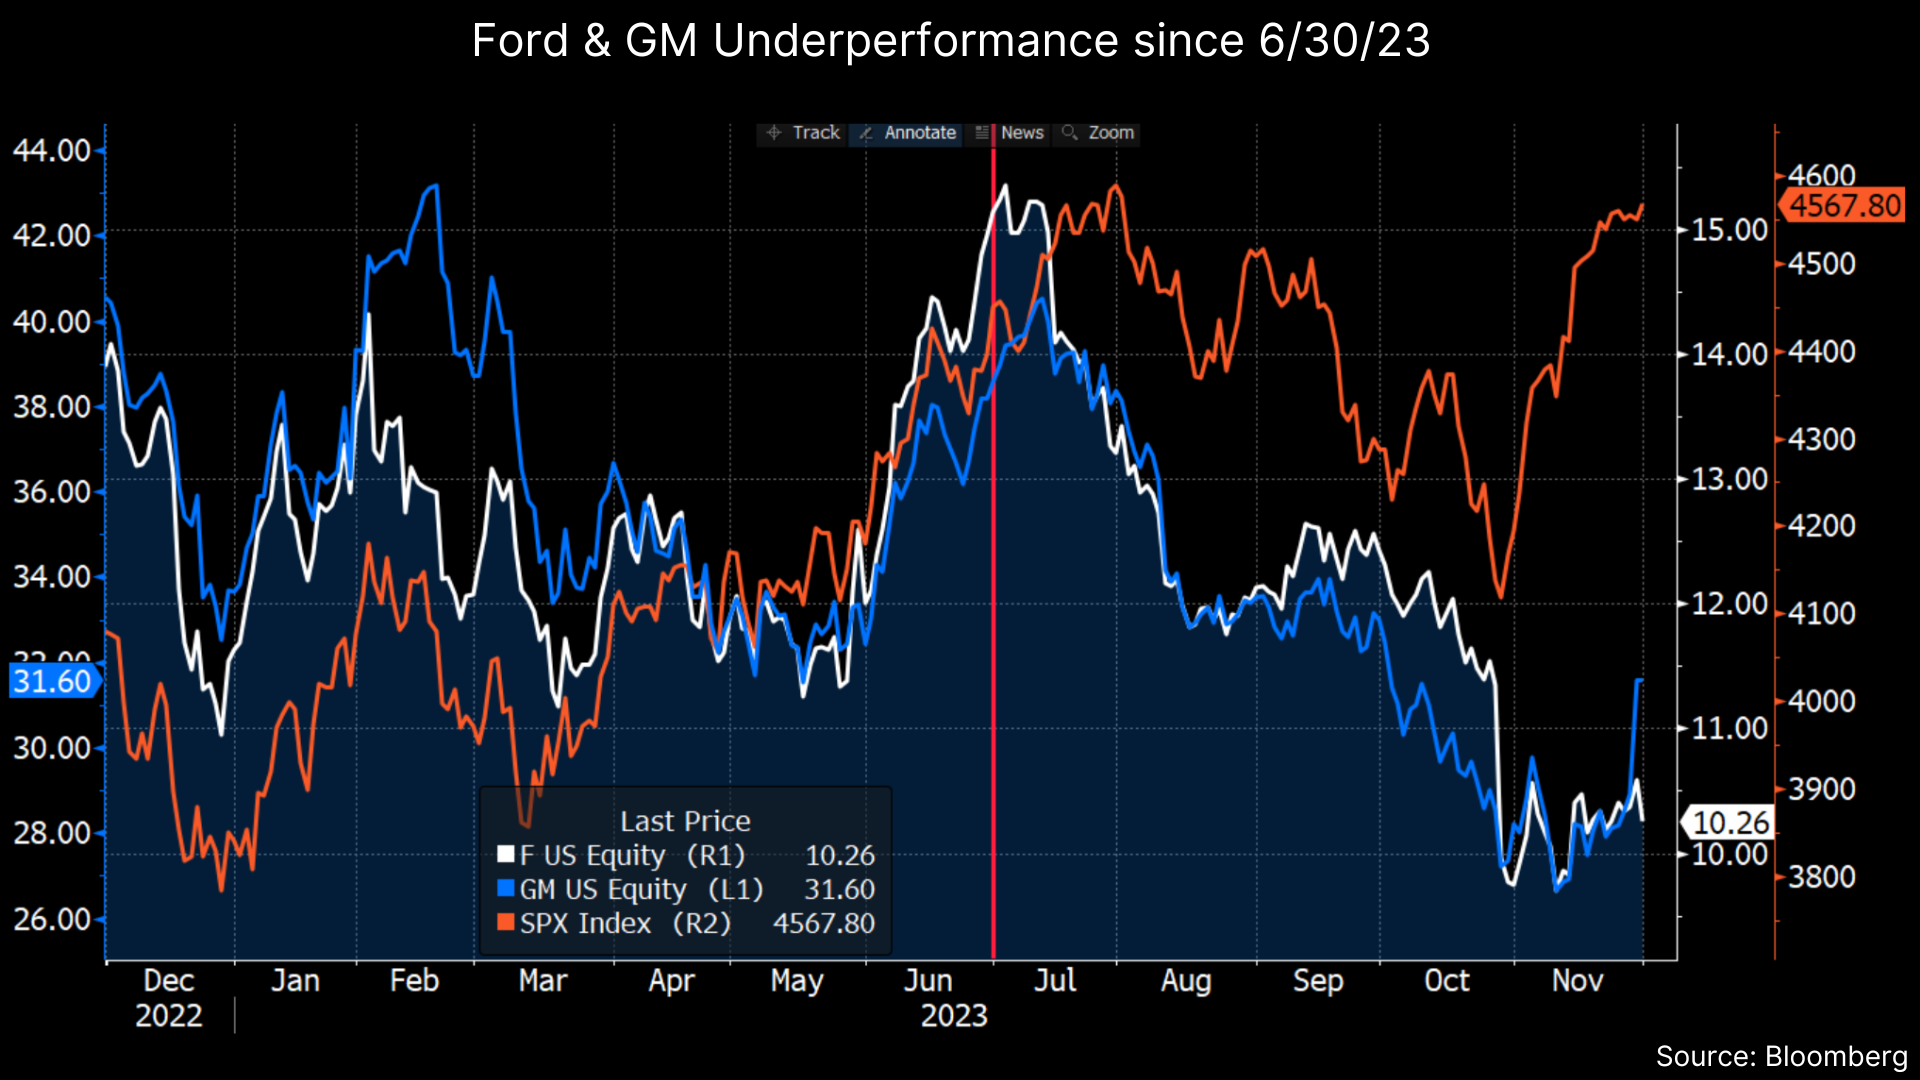
Since June 30, Ford and GM are down 32% and 18%, respectively, dramatically underperforming the S&P 500, which is up about 2.9% over the same time frame. This naturally begs the question: Are the stocks “cheap” and worth buying? In our view, they are slightly cheap but value traps due to their complexity, massive capital needs, high structural labor costs and extremely competitive markets. We think the transition to EVs is going to drive uncertainty and weigh on valuations for some time. And we believe this is not the time in the economic cycle to own highly cyclical business even at optically “cheaper” valuations. Given that each company is made up multiple parts, which we discuss in detail, we prefer getting long equities closer to a floor price (high single digits on Ford, and low $20s on GM) where the implied value for the automotive business is lower than current. Given large cash balances and zero net debt, we think the automotive bonds at the front end of the curve (<5yrs) carry very little credit risk and offer reasonable yields at ~6.3% for F and 5.5% for GM. To the extent the economic cycle turns and spreads widen out, we would consider longer dated bonds.
Background
Before getting into valuation, which is tricky, some background is warranted.
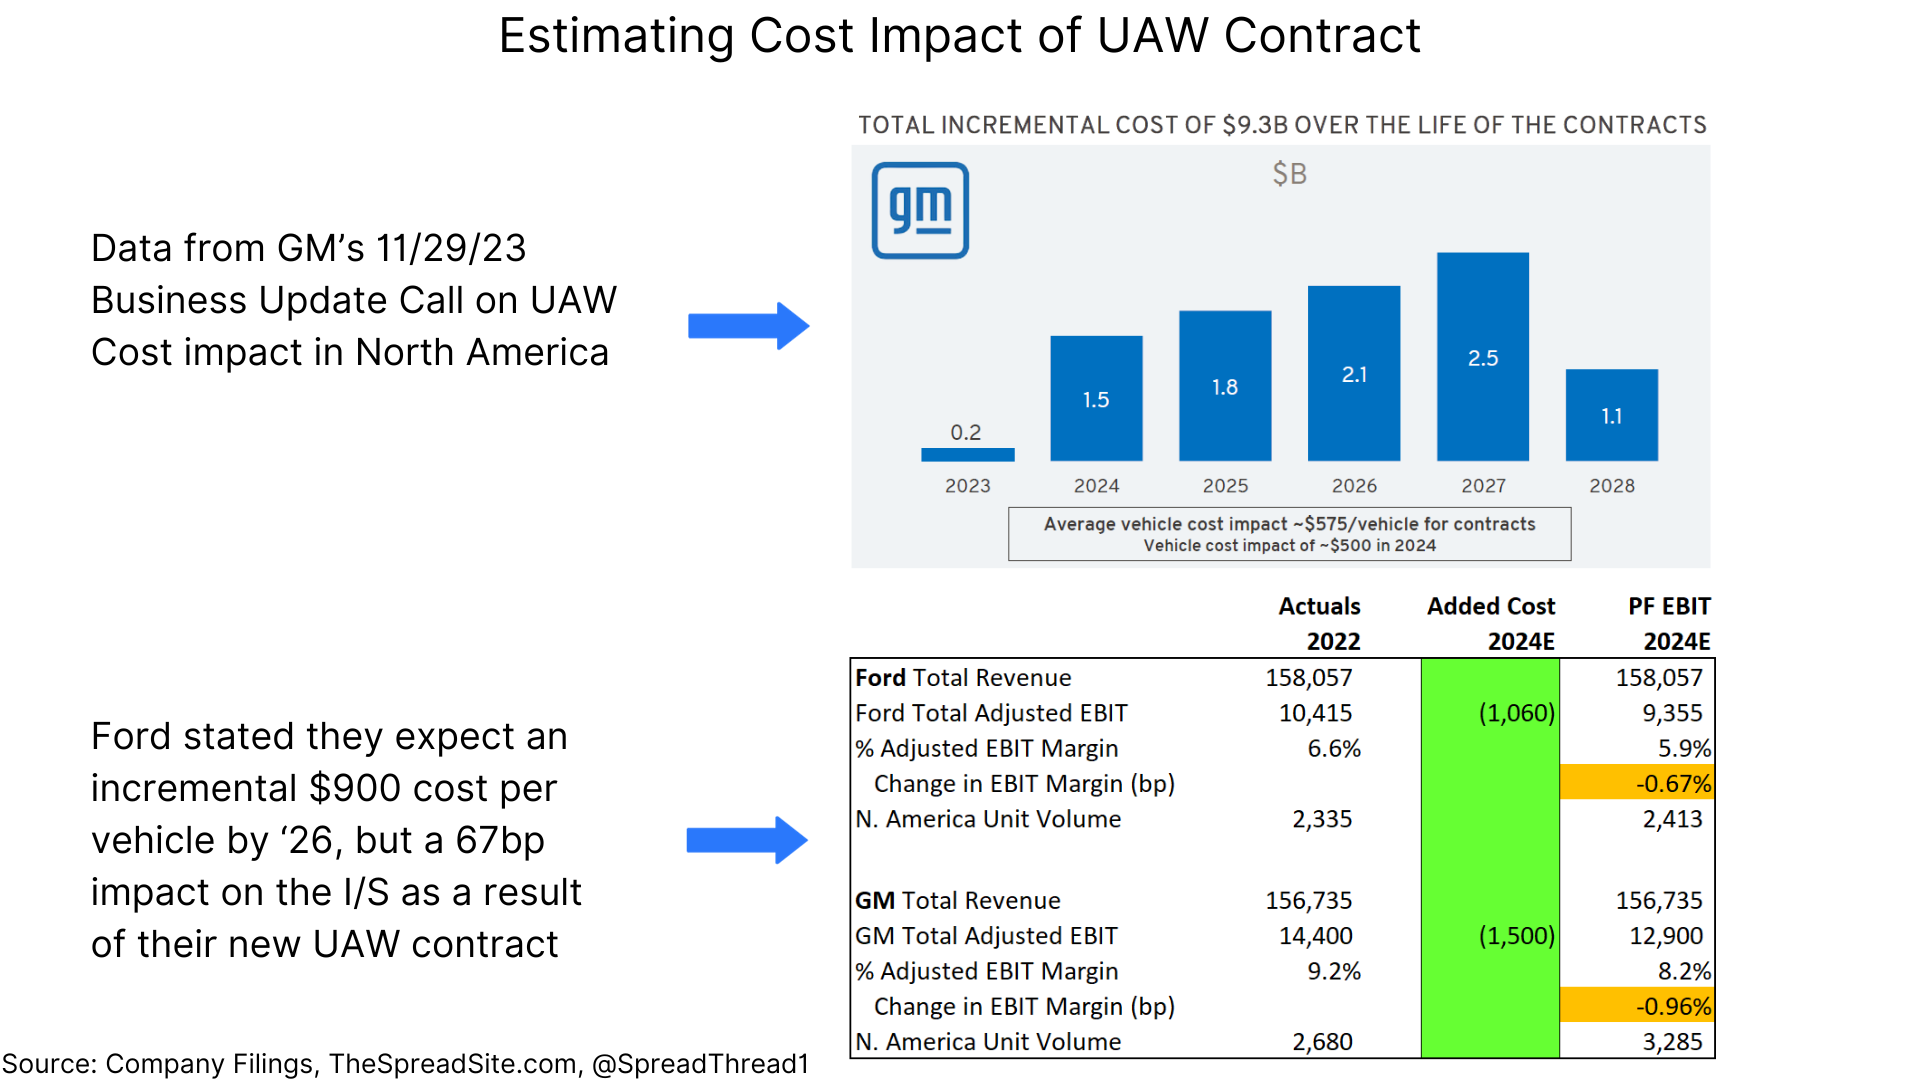
In our view, there are two main drivers behind the recent underperformance. The first, which we discussed in our report titled "UAW Strike: Shock Wave or Ripple" was labor contract negotiations, with the UAW partaking in targeted strikes and ultimately achieving significant concessions in terms of employee pay and benefits. So far, GM has provided more granularity around the cost increase and says they expect to fully offset the increases with cost savings. Ford said they expect an additional $900 in incremental cost per vehicle but without the granularity shown by GM. Below we attempt to put the cost increases in context, but note that projecting out the actual cash costs vs productivity savings gains remains a guesstimate at best.
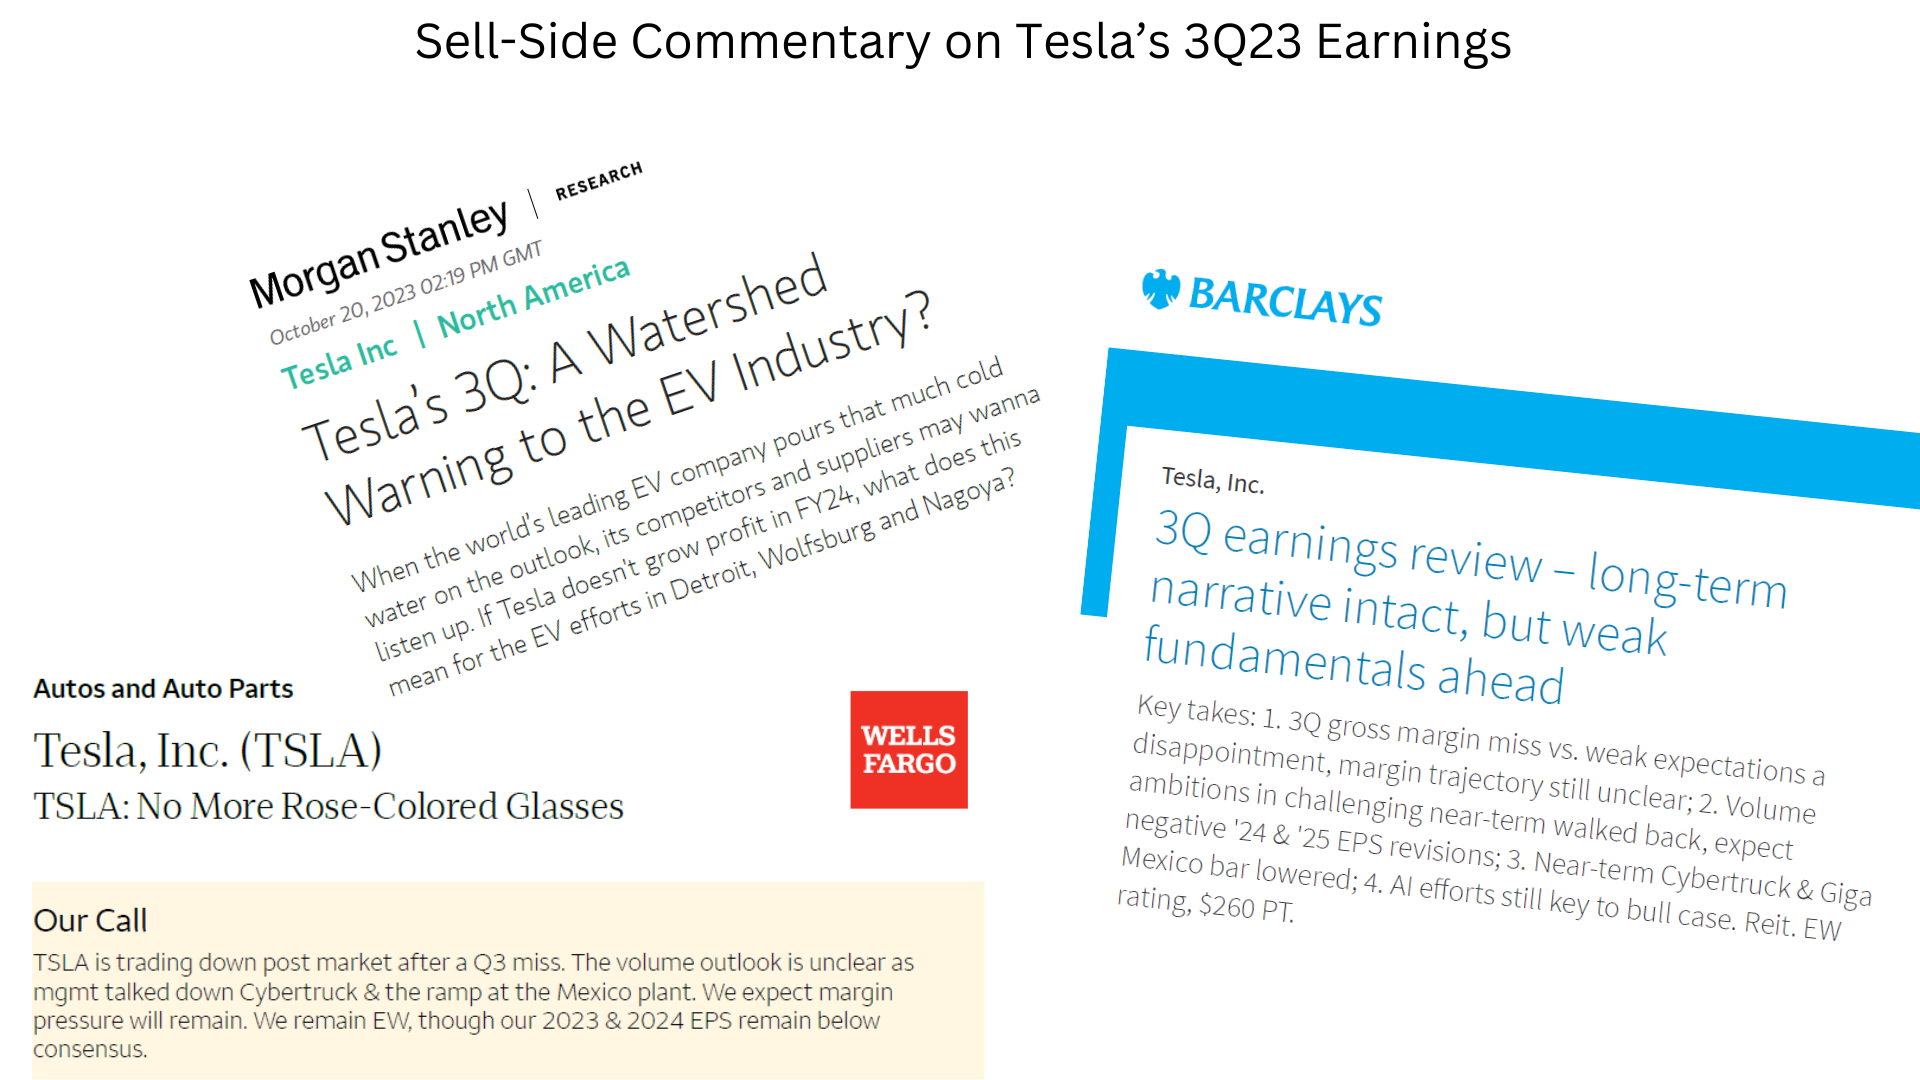
The second driver of recent underperformance, which remains fluid, is the demand and margin environment around Electric Vehicles (“EVs”). Tesla, the current market share leader in EVs, cut prices multiple times (cumulatively ~25% on average across their range) which is reverberating across other OEM’s and their EVs. In addition, Tesla’s recent 3Q23 earnings call tempered demand and margin expectations for the entire EV industry.
This is important to F and GM given both are making major investments to ramp up EV production, which is now more uncertain. As the mix of EVs carrying lower margins starts increasing it naturally pulls down overall company margins. Clearly, the entire automotive industry is moving towards electric, but F and GM currently earn solid margins (for auto makers) on their internal combustion engine vehicles (“ICE”), especially in the North America market.
As we show below, EV penetration is <3% for F and GM and while GM’s disclosure is limited, their EV margins are likely deeply negative, similar to Ford.
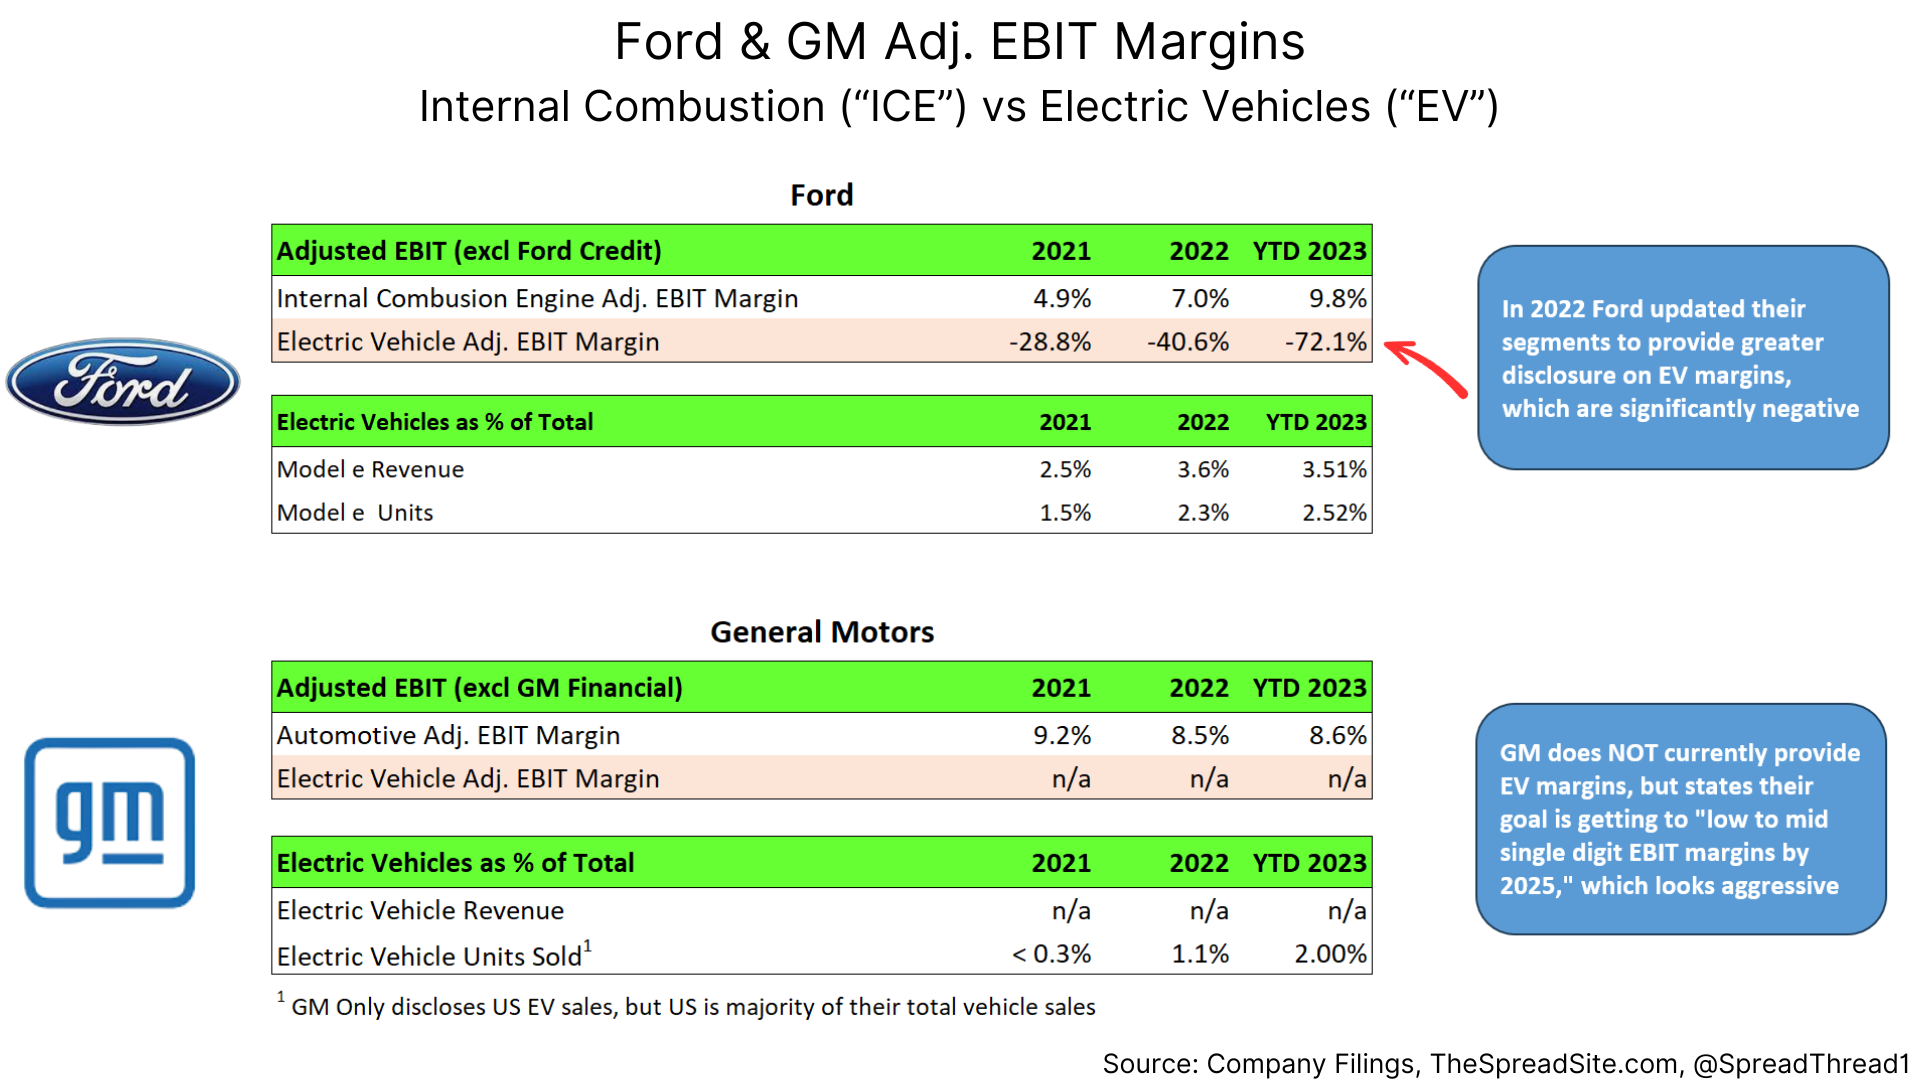
Ford is seen as less “all in” on EVs even though they will make up a significant percentage of their mix in 2026 and beyond. At their May 2023 Investor Day, Ford stated they hope to produce 600k EV units in 2024 (~13% of total units) and have closer to 2mm units of EV capacity (including their Pro segment) by 2026 while getting their “Model e” EV segment to an 8% EBIT margin. However, on their 3Q23 earnings call, Ford highlighted the difficult EV pricing environment and said they were pushing back about $12b of EV related capex.
GM’s goal is getting to a “low to mid-single-digit EBIT EV margin” by 2025 with annual EV capacity of 1mm units in North America (~25% of total) as they exit 2025. They have reiterated their commitment to an “all electric future” on their 3Q23 earnings call and again during their November 2023 business update call. However, they also highlighted near-term weakness with a plan to moderate their pace of EV production as market conditions warrant. In addition to a greater commitment to EVs relative to F, continued challenges in GM’s “Cruise” self-driving platform adds another layer of uncertainty. This business is approaching negative $2b of EBIT losses for 2023 with a questionable path to profitability. GM holds an 80% stake in Cruise with JPM putting their stake at a valuation of ~$13b or $9.50/shr (we assume discounts to this in our valuation section).
Quick Sidebar On Auto OEM Financials
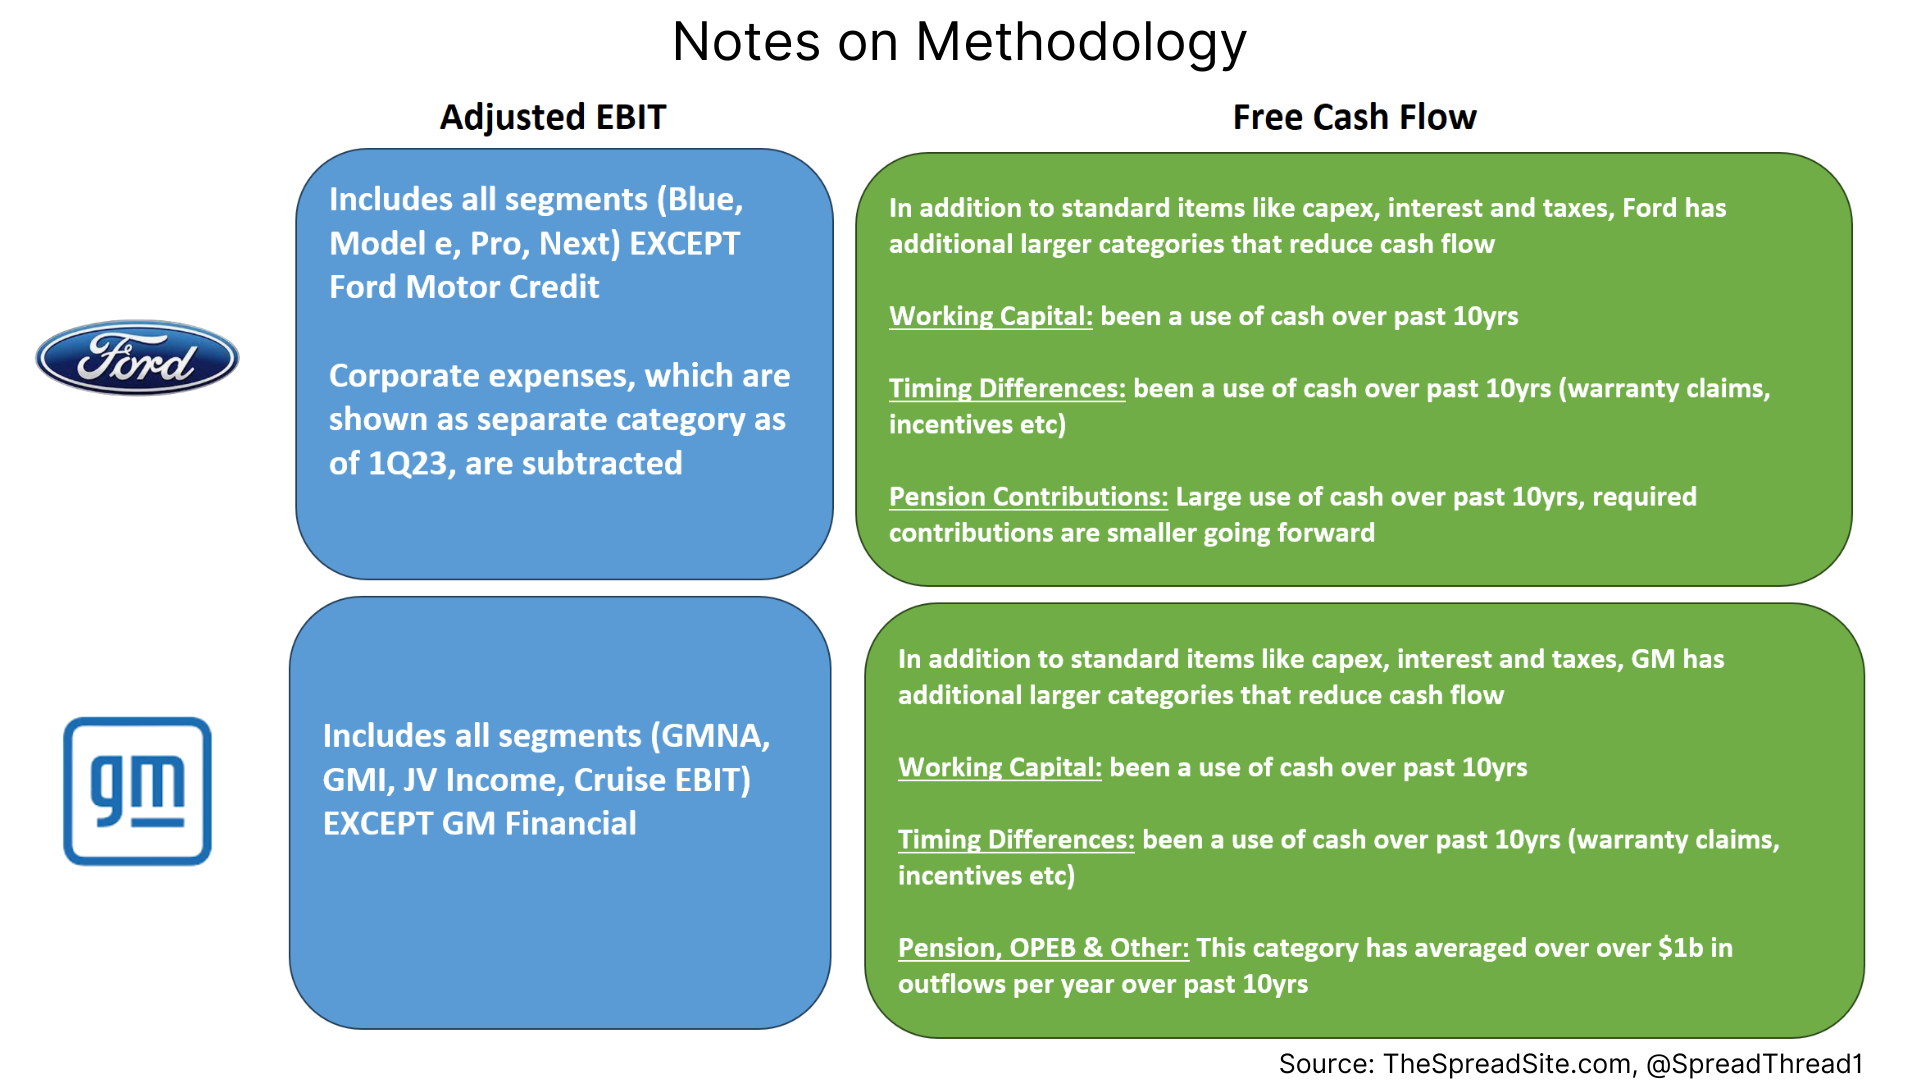
Before getting into valuation in the next section we highlight a few categories within most auto companies that create confusion and differences in most financial metrics.
- Pension & OPEB: Both companies have pension and OPEB (basically healthcare) plans, where expenses and cash flows can be difficult to understand.
- Warranty & Dealer Incentives: This is another area where an expense item flowing through the Income Statement can vary from the cash impact. Each company attempts to reconcile these timing differences when presenting free cash flow.
- Auto Finance: Both Ford and GM have large finance operations typically analyzed separately in terms of book value, EBIT and net debt.
- Joint Ventures: GM primarily sells vehicles in China through JVs. Accounting for and valuing this segment can be confusing and is often valued separately.
The categories above all have GAAP accounting-based income and expenses running through the income statement that can differ significantly from cash amounts. Consequently, this can lead to valuation methods like P/E and EV/EBITDA and metrics like EBIT, EBITDA and Free Cash Flow to vary by company and analyst.
Valuation Scenarios
Forecasting cash flows 10 years out for F and GM as they transition to significantly more EV production is fraught with uncertainty. The scenarios below attempt to frame the discussion while illustrating the moving parts and what the share price implies for the auto production businesses.
Over the past 10years (2013 to 2022) F averaged a 4.2% Adjusted EBIT margin (using Adjusted EBIT highlighted above) and GM averaged 6.7%. Over the same time period, F averaged ~0% free cash flow/ revenue, and GM averaged 2.2%. Again, this EXCLUDES the finance businesses. Everyone knows building cars is capital-intensive, but it can be surprising how little free cash drops to the bottom line throughout a cycle (we note that ’22 and ’23 have been very strong FCF years for F and GM). This is a big reason why auto manufacturing businesses (excluding Tesla) trade at very low multiples.
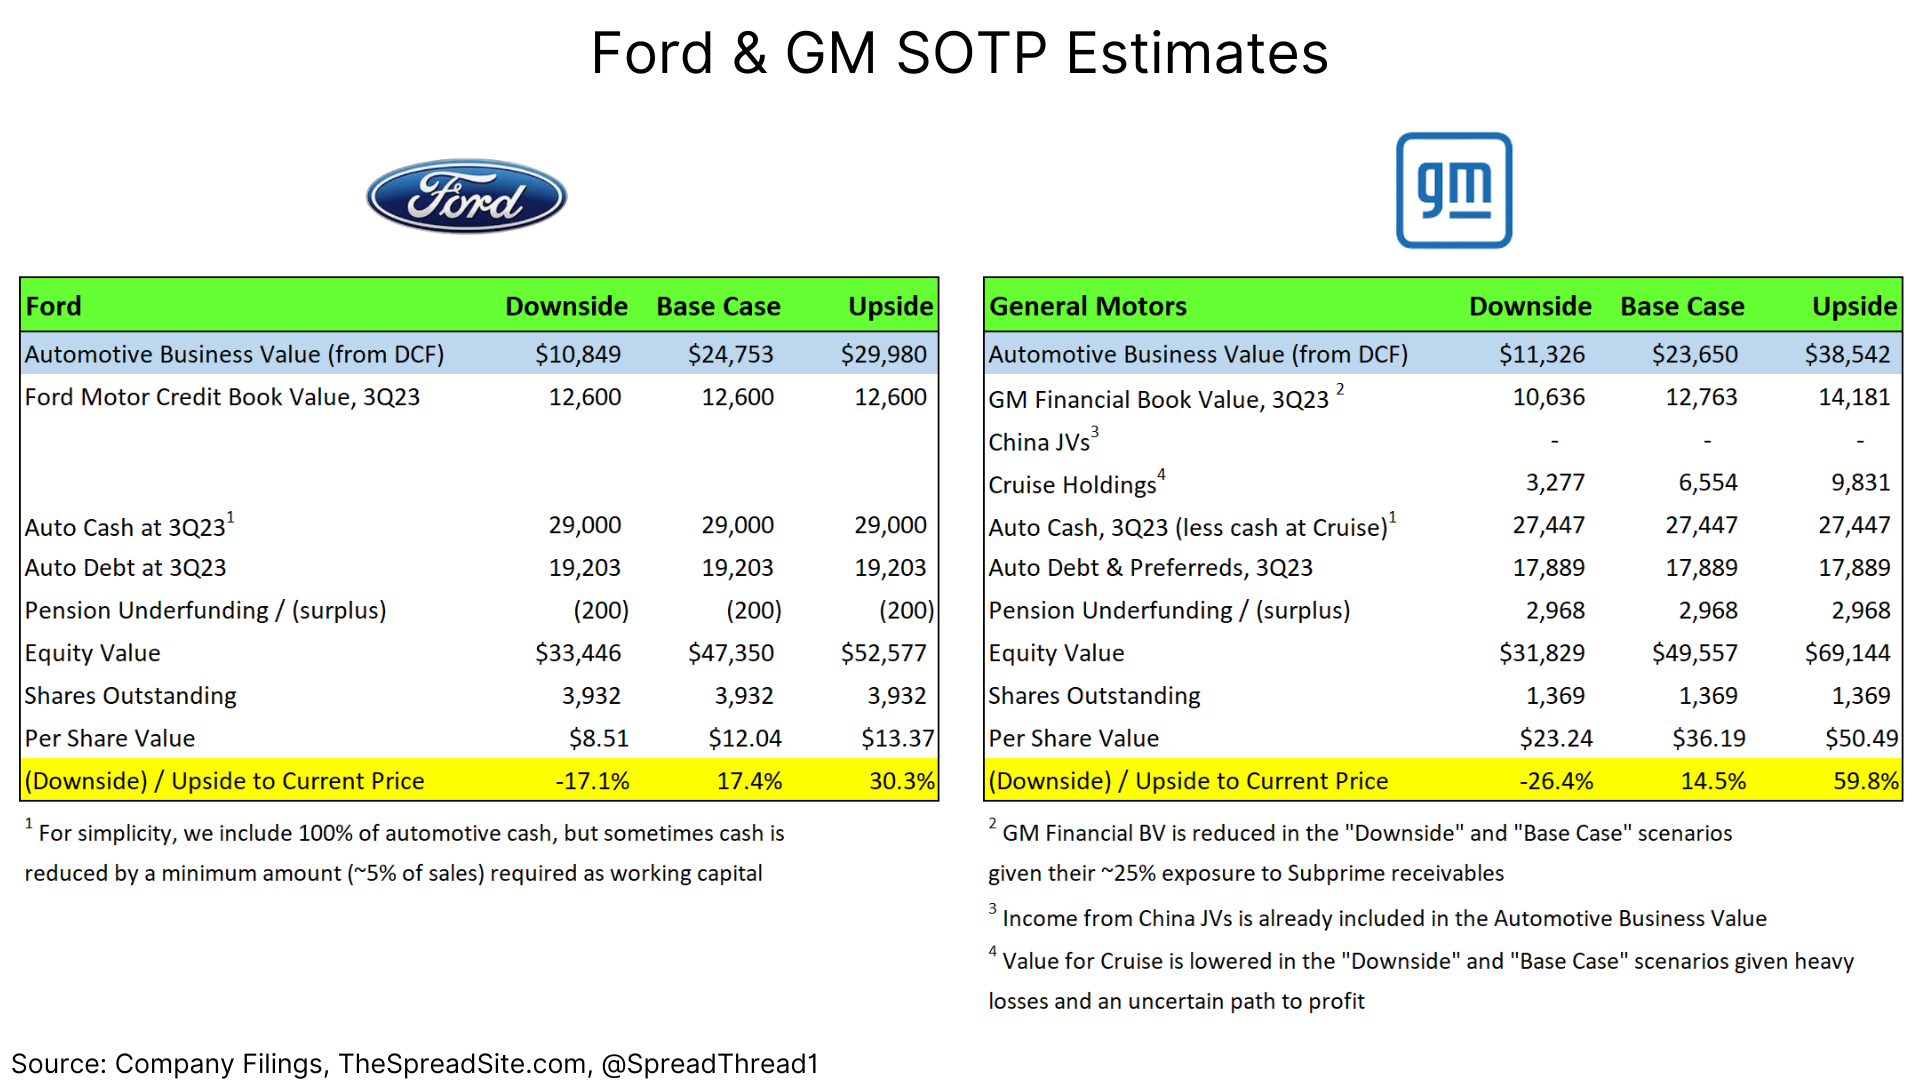
Below we show three scenarios, “Downside,” “Base Case” and “Upside.” Each scenario values the automotive businesses using a DCF and adds in the “other” parts separately. In the case of Ford, this includes net automotive debt, underfunded pensions, and Ford Motor Credit. In the case of GM, this includes net automotive debt, underfunded pensions, GM Financial and Cruise (we show the sum-of-the parts (“SOTP”) calculations in a separate table).
Assumptions baked into our scenarios:
- “Upside” mainly uses current consensus estimates through 2026 and then assumes historical average metrics in 2027 to 2033.
- “Base Case” assumes EBIT margins are ~150bp lower than “Upside” during the EV transition from 2024 to 2026 and then reverts to roughly historical average metrics beyond.
- “Downside” assumes EBIT margins 200bp lower than “Upside”, but also assumes long-term EBIT margins are 100bp lower than historical averages. Essentially this scenario assumes margins remain structurally lower as legacy OEMs like F and GM compete with arguably more efficient automakers.
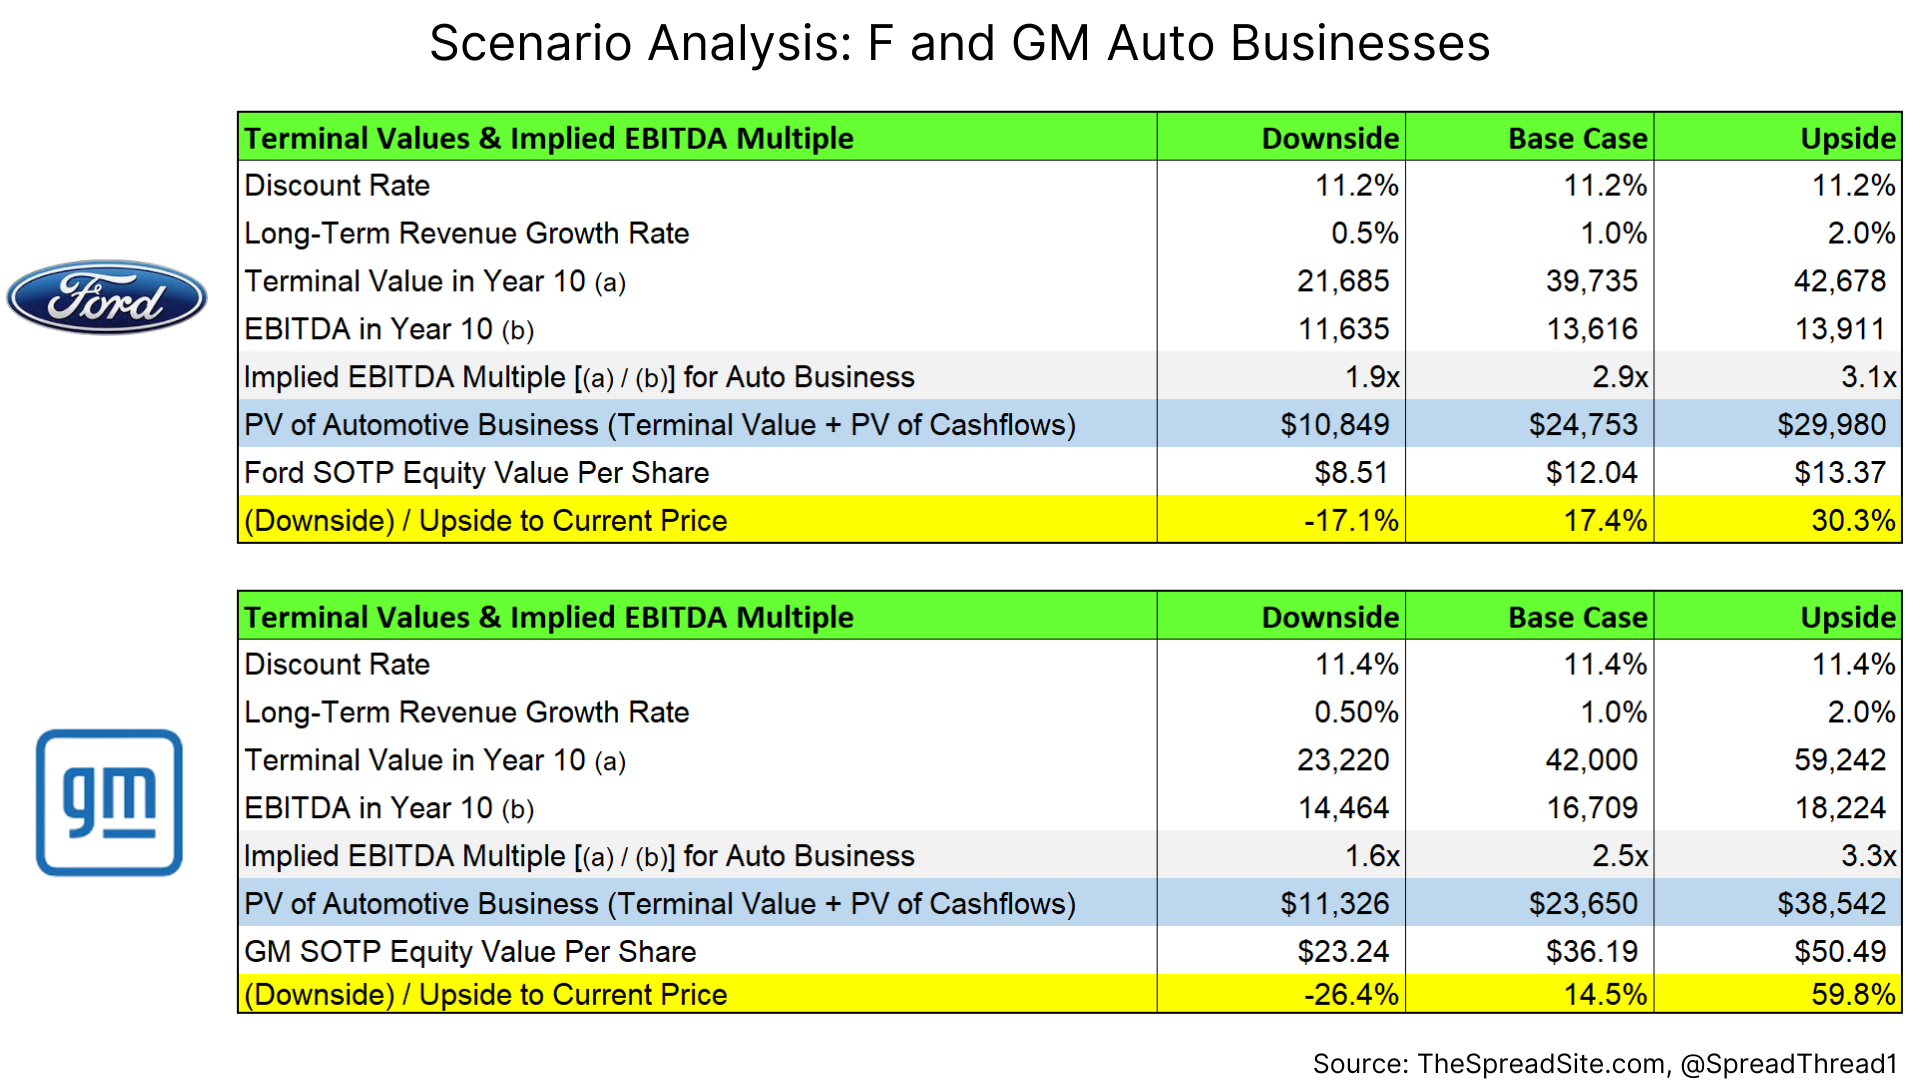
We arrive at per share values shown above using a SOTP approach (shown in next section) where we take the values for each company’s automotive business determined above and value the remaining pieces separately.
Sum of the Parts
There are an infinite number of possible outcomes, but based on a SOTP approach, GM’s auto business does trade at a lower multiple, even though they have a more profitable ICE business and a higher percentage of business in the more profitable N. America region. However, they are more committed to an all-EV future so the path of outcomes is more uncertain relative to Ford.
In terms of a reasonable floor on valuation, GM’s “parts” other than the auto business are worth roughly $22.00/share, which then implies a valuation for the automotive business of ~$10/share (i.e. another $13b to get to current market price). For Ford, this floor is $5.75/share implying a value for the auto business of $4.50/share (i.e. another $18b to get to current market price).
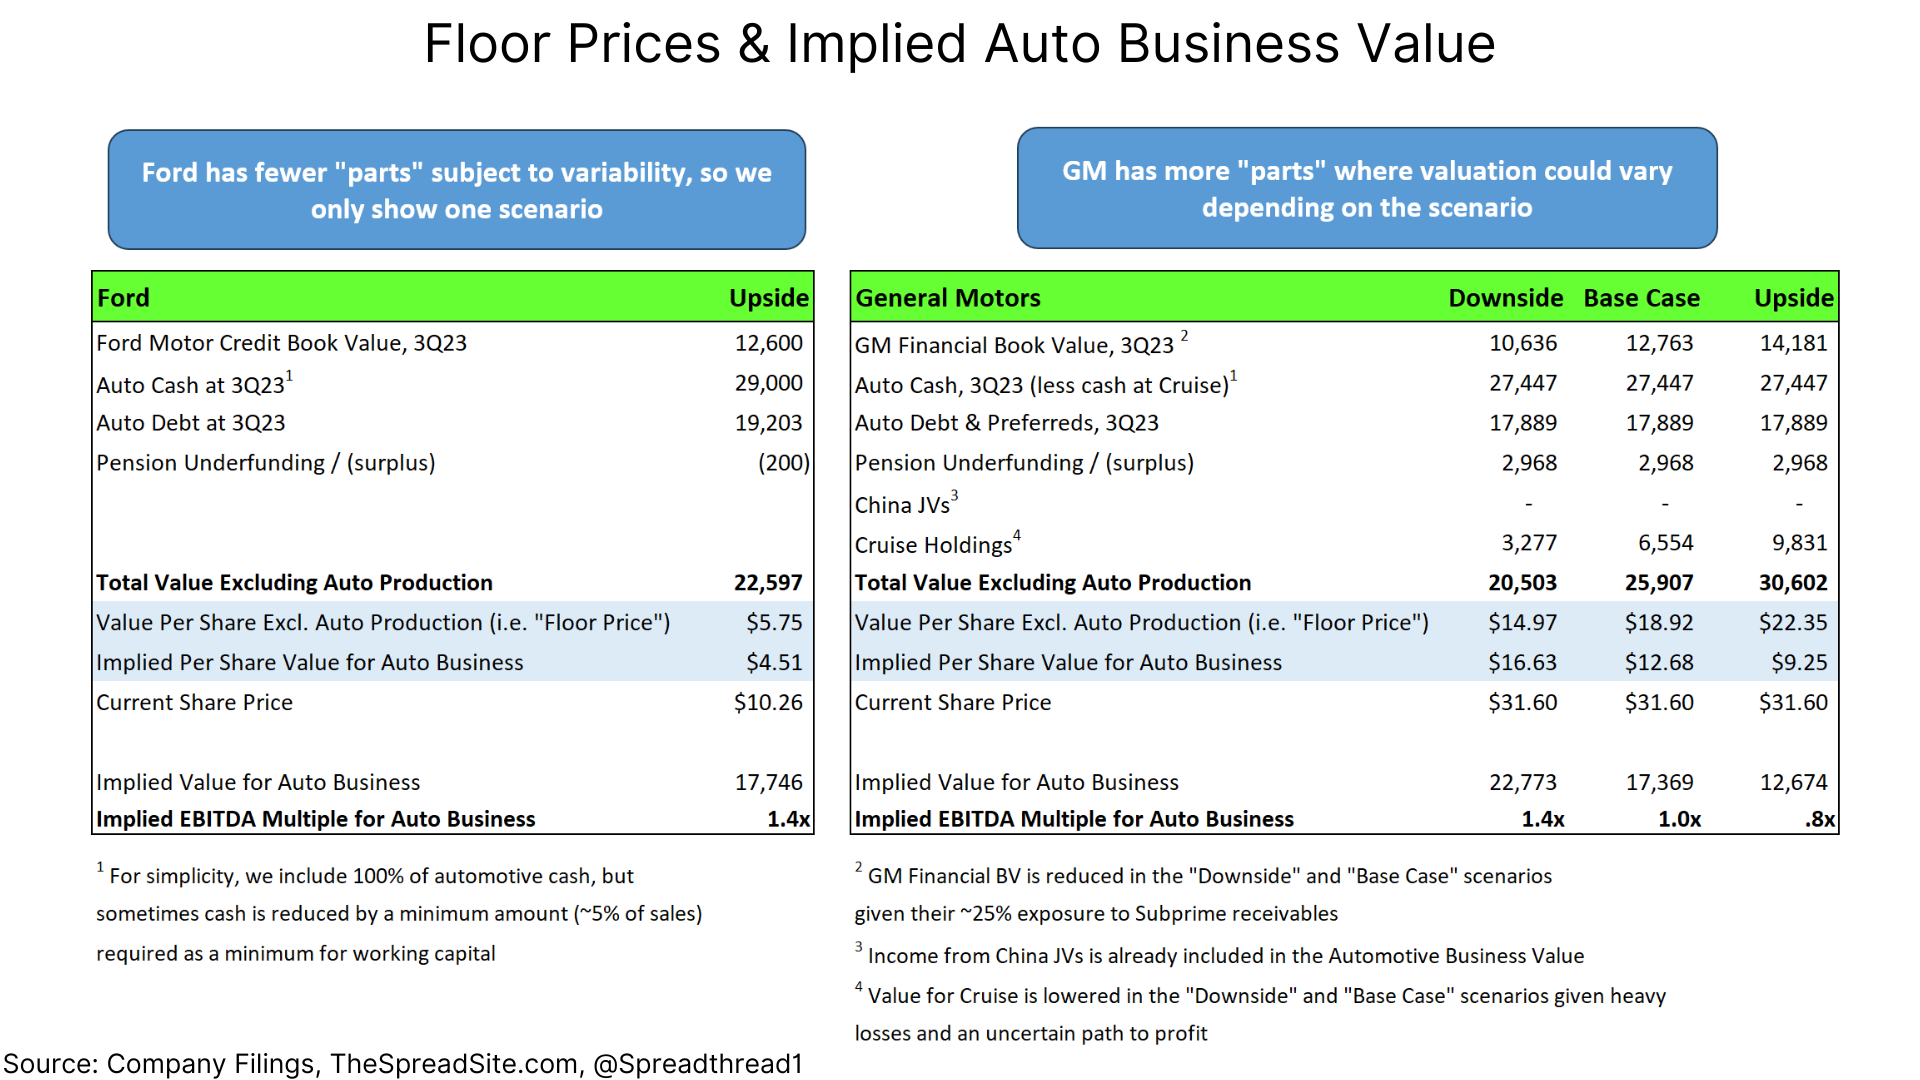
We have done less in-depth analysis on the European auto sector but note/warn that Volkswagen currently implies a negative value for their automotive business. Consequently, we think a price in the low-to-mid $20s for GM and high single digits for Ford are levels that appropriately compensate investors for the risks, in our view.
Summing up, we think F and GM are value traps due to their complexity, massive capital needs, high structural labor costs and extremely competitive markets. We think the transition to EVs is going to drive uncertainty and weigh on valuations for some time. And we believe this is not the time in the cycle to own highly cyclical businesses (more below), even at optically “cheaper” valuations. Anyone reading our macro commentary knows we have a more pessimistic economic outlook and for this reason we think both companies carry a large amount of “cyclical risk” in addition to the secular challenges (i.e., transition to EV), noted above.
While our base case shows 17% and 14% upside, respectively, we think there is greater probability of outcomes somewhere between the “downside” and “base case.”
Even in boom times, they have an artificial ceiling looming in the form of future UAW contract negotiations which occur every four years. Some argue that current share prices implying a <1.5x EBITDA multiple for the auto businesses is too cheap, but given all the complexities and uncertainties we highlight, at current prices, this is not a bet we are comfortable making.
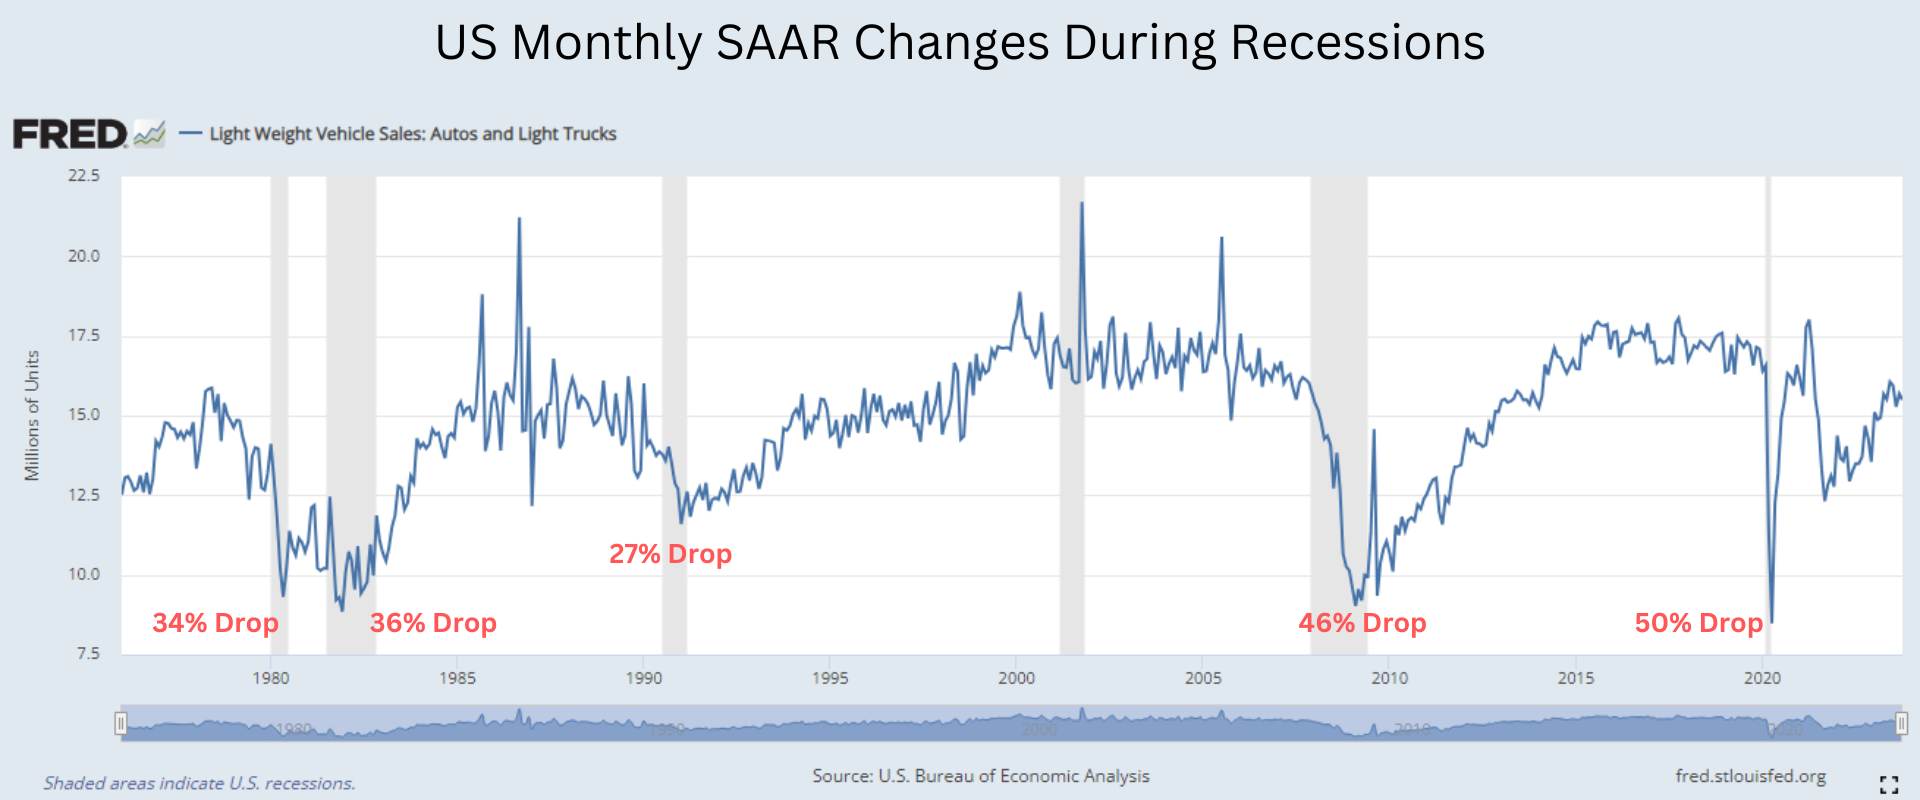
GM provided a breakeven N. America seasonally annualized selling rate (“SAAR”) of 10-11mm as of their 2020 10k, with Ford at around 11mm units (last update was a few years ago) and we are currently around a 15.5mm SAAR. If we assume a recession scenario where SAAR declines by ~30%, both companies should remain near breakeven EBIT but their equities could have another 20 to 30% of downside.
Debt & Preferreds
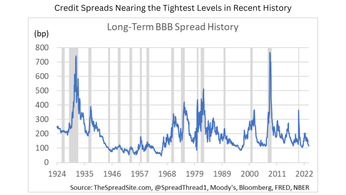
Finally, we end with a few brief comments on the credit at F and GM. In short, unsecured debt at F and GM trades slightly wide (30 to 50bp) to their triple B ratings benchmarks. We do not have near-term credit concerns at F or GM automotive, but think BBB credit spreads generally are too tight. For reference, we show benchmark bonds below.
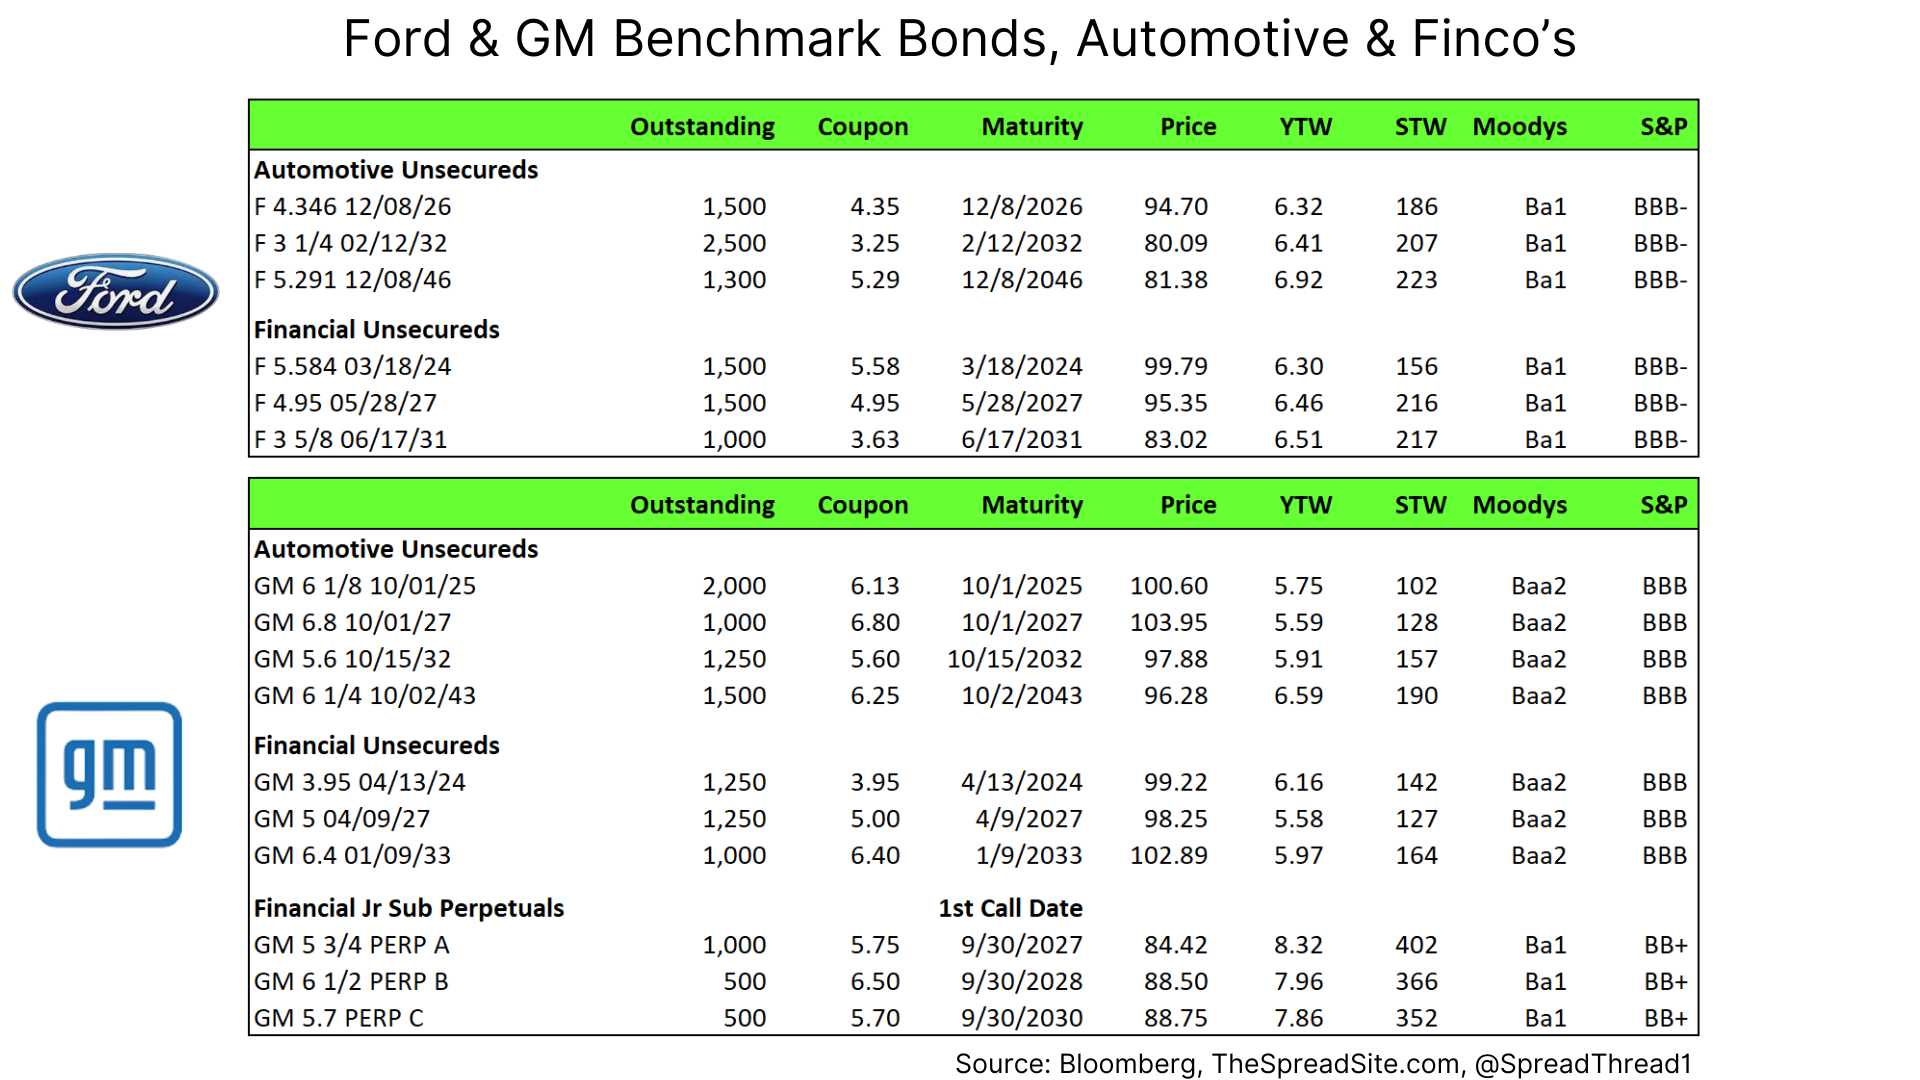
Given that the auto businesses have net cash (even after subtracting cash equal to ~5% of sales as a working capital minimum) and substantial incremental liquidity, we think short-dated bonds (<5yrs) are safe and offer reasonable yields around 6.4% for F and 5.6% for GM. But while we don’t see F and GM as having high default risk in almost any short to medium-term scenario, longer-dated bonds don't offer enough compensation for the many long-term uncertainties, in our view. To the extent spreads widen in a cyclical downturn we would re-evaluate longer dated bonds with a preference for low dollar prices given the tremendous uncertainties involved with auto production.
Disclosures
Please click here to see our standard Legal Disclosures
The Spread Site Research
Receive our latest publications directly to your inbox. Its Free!.


