Charts and Screens
The key charts we are watching and/or idea screens
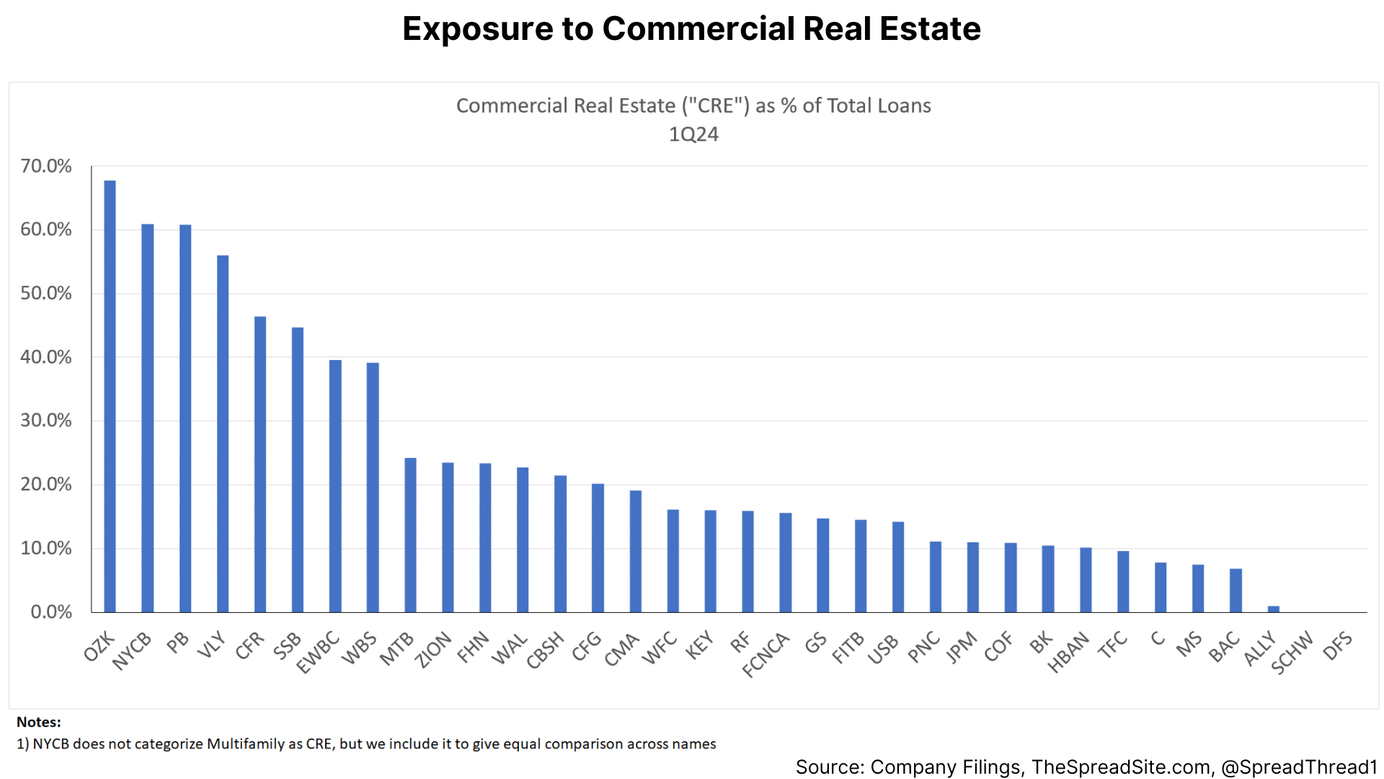
Bank Stocks, Charts & Data: 1Q24 Paid Members Public
The Banking Sector In Charts We are through 1Q24 bank earnings and compile our quarterly charts below. Data is sourced from 10Qs, supplemental data issued with earnings releases or via Call Reports available on the FDIC's website. Our method, generally speaking, is to include all banks in the
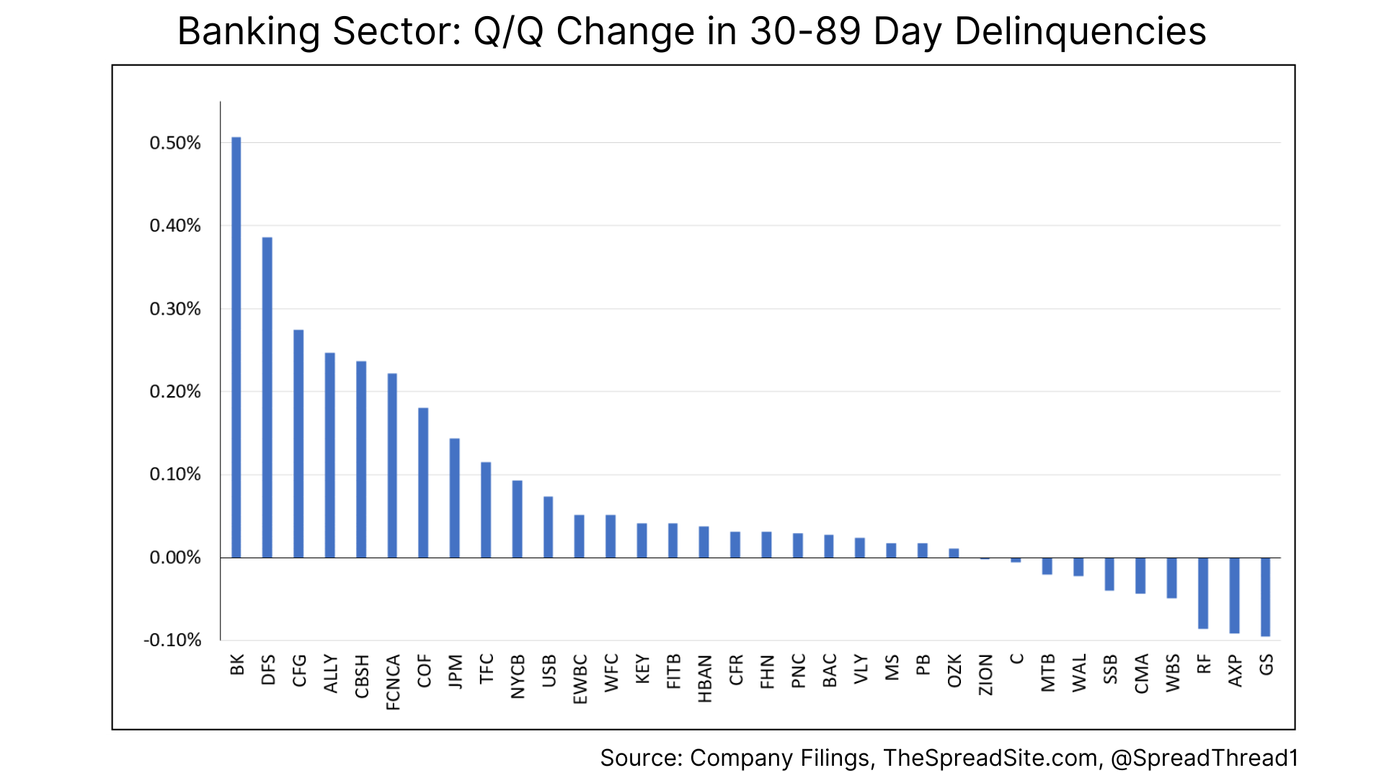
Bank Stocks, Charts & Data: 4Q23 Paid Members Public
The Banking Sector In Charts We are through 4Q23 bank earnings and have a few weeks until all companies file their 10Ks. Aside from a few data points, most information compiled is available through the Call Reports available on the FDIC's website or supplemental data issued with earnings
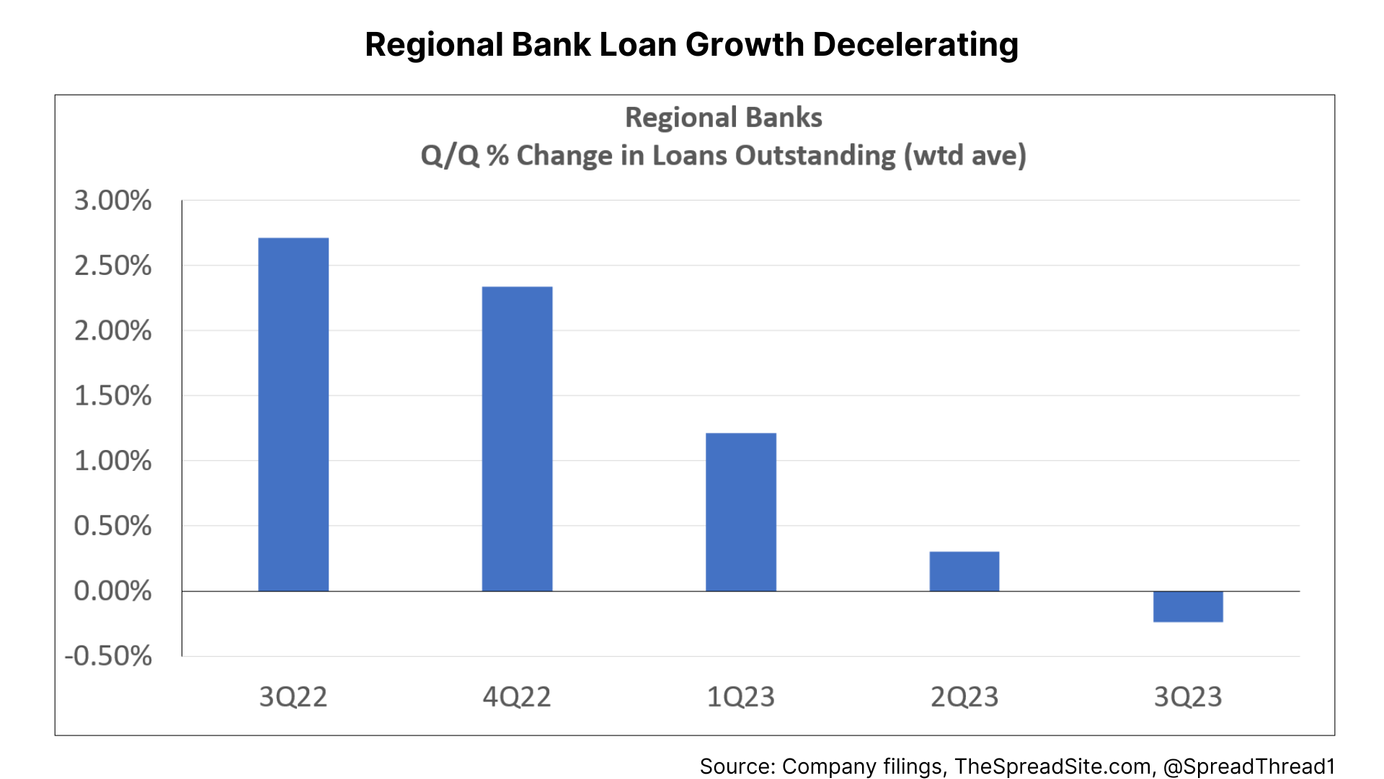
Bank Stocks, Charts & Data: 3Q23 Paid Members Public
The Banking Sector In Charts We are through 3Q23 earnings and all companies have filed their 10Qs. We present fundamental data across the sector, in chart form. Our method, generally speaking, is to include all banks in the "KRE" Regional Bank ETF greater than ~$5b of market cap

Bank Stocks, Charts & Data: 2Q23 Paid Members Public
The Banking Sector In Charts Now that banks have reported 2Q23 earnings and filed their 10Qs, we present fundamental data across the sector, in chart form. Held To Maturity ("HTM") Securities Starting with HTM portfolios, we note that since 6/30/23 (for most banks, this is their

